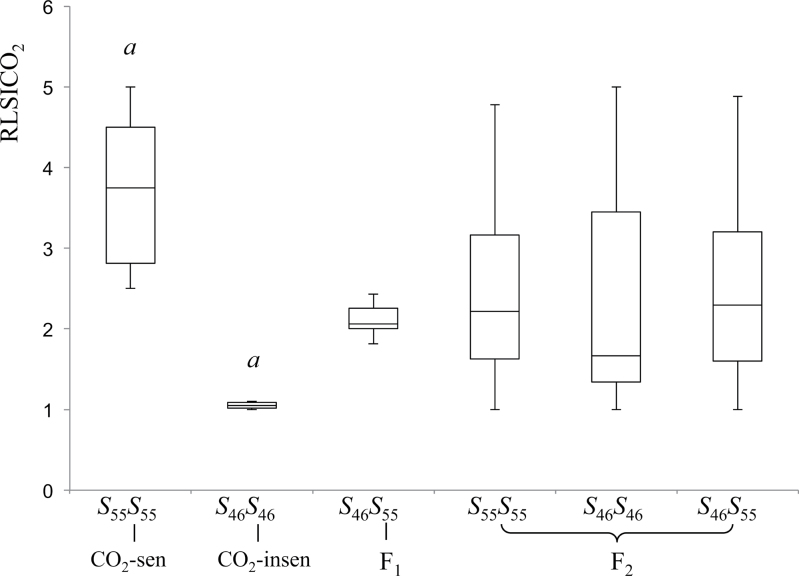
Fig. 5.
Box plots of CO2 sensitivity phenotypes. Data show the distribution of RLSICO2 with 25th, 50th, and 75th percentiles (horizontal bars), interquartile ranges (columns), and 1.5 interquartile ranges (error bars) of RLSICO2 from six CO2-sensitive (S 55 S 55) and six CO2-insensitive (S 46 S 46), individuals, six F1 individuals (S 46 S 55), and 110 F2 individuals (22 S 46 S 46, 64 S 46 S 55, and 24 S 55 S 55). a indicates a significant difference (P < 0.01) between CO2-sensitive and CO2-insensitive lines.

