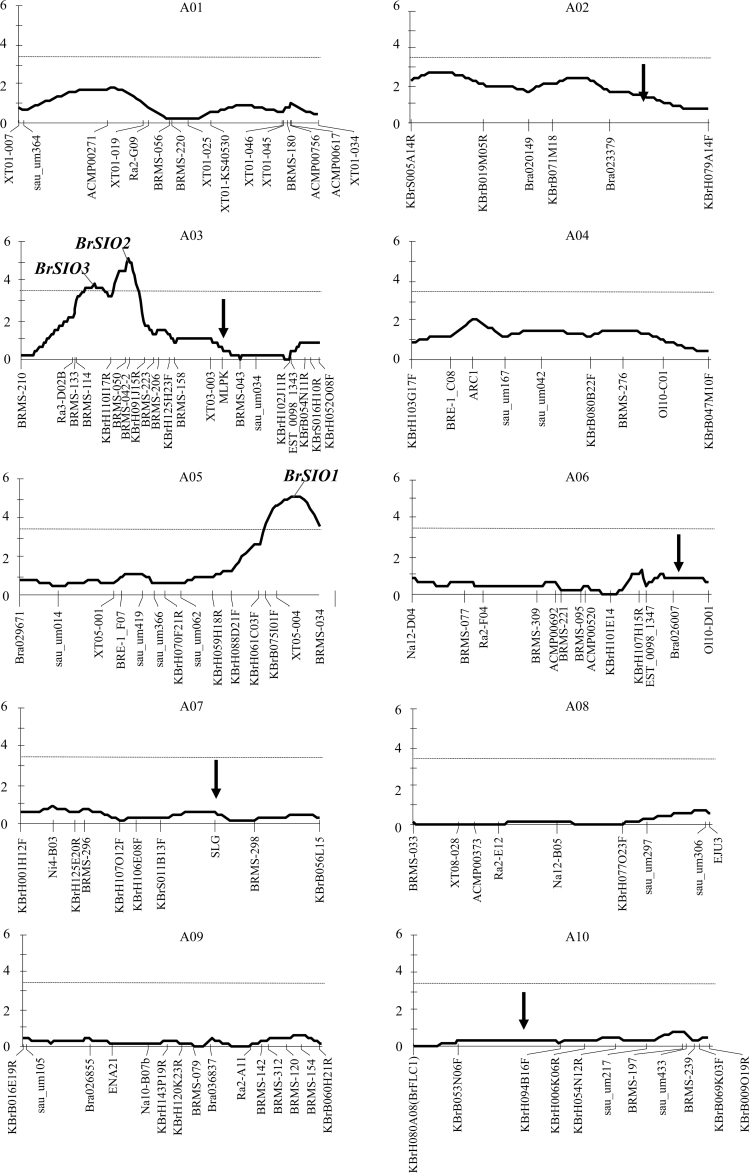
Fig. 8.
QTL analysis results. The solid line indicates the LOD score and the dotted line indicates the QTL threshold (LOD=3.4) determined using a 1000 permutation test (P < 0.05). The x-axis represents each linkage group (cM) and the y-axis indicates the QTL score. Two QTLs (BrSIO2 and 3) are detected in A03 and one in A05 (BrSIO1). Arrows show loci involved in SI stability reported by Hatakeyama et al. (2010).

