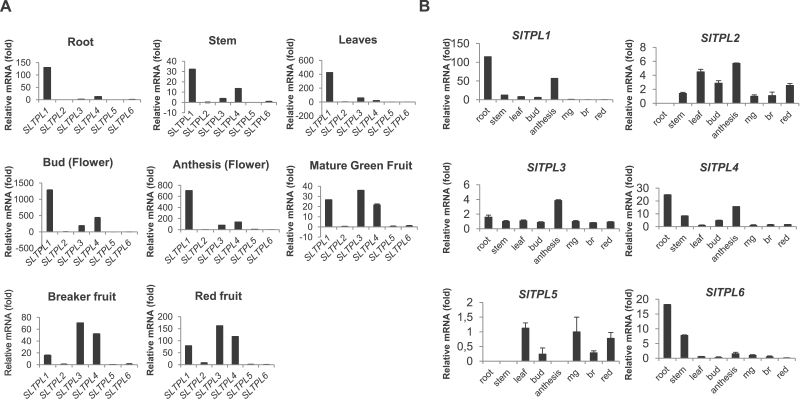
Fig. 5.
Real-time PCR expression profiles of six tomato TPL genes. (A) Expression patterns of SlTPL genes in various tomato tissues. Relative mRNA levels of each SlTPL gene in different tissues were normalized against actin. The results were expressed using SlTPL6 as a reference (relative mRNA level 1). Values represent the best experiment among three independent biological repetitions. Bars indicate the standard deviation of three experimental repetitions. (B) Expression patterns in different tomato tissues of each SlTPL gene. The relative mRNA level of each SlTPL gene was normalized against actin. mg, Mature green fruit; br, breaker fruit; red, red fruit. The results were expressed using the mature green fruit as a reference (relative mRNA level 1). Values represent the best experiment among three independent biological repetitions. Bars indicate the standard deviation of three experimental repetitions.

