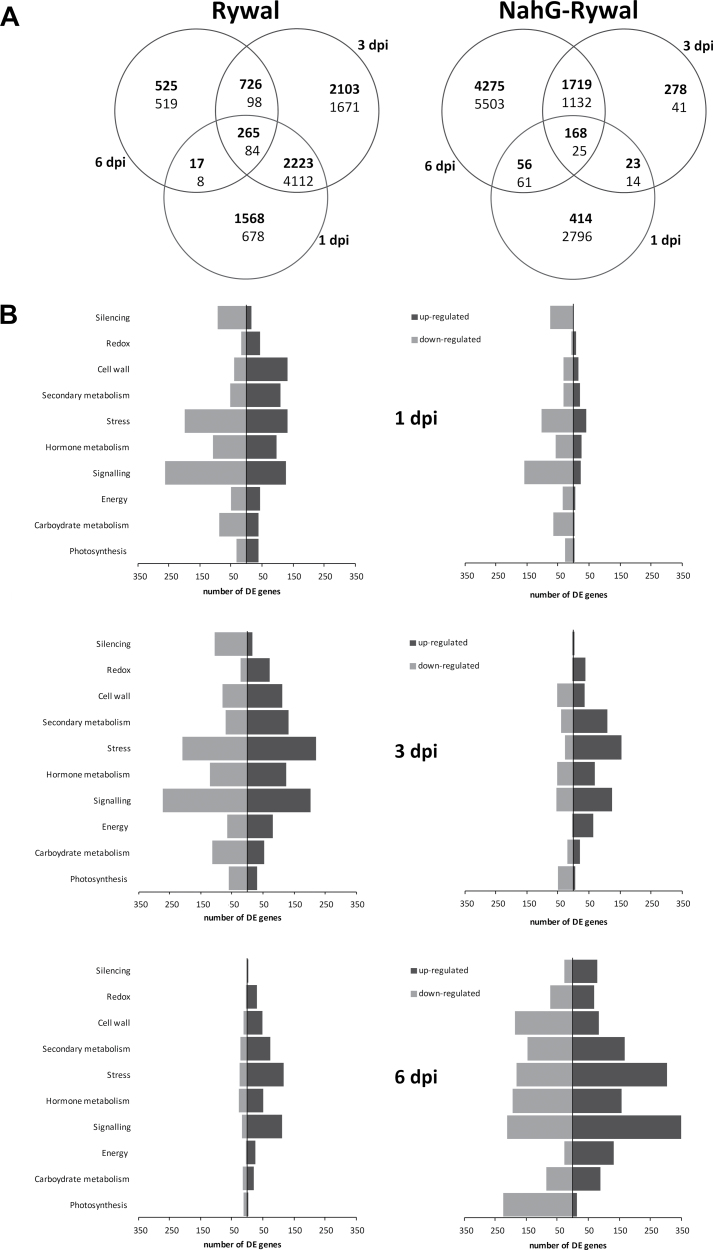
Fig. 5.
Differentially expressed (DE) genes in virus vs. mock treated plants of cv. Rywal (left) and NahG-Rywal (right) at 1, 3, and 6 d post infection (dpi). (A) Venn diagram of all of the DE genes (bold, upregulated; regular, downregulated). (B) Representation of numbers of DE genes (black, upregulated; grey, downregulated) in the selected functional groups; MapMan ontology bins: photosynthesis (bins 1, 19), carbohydrate metabolism (minor CHO, major CHO, gluconeogenesis; 2, 3, 6), energy (glycolysis, fermentation, OPP, TCA/organic transformation, mitochondrial electron transport/ATP synthesis; 4, 5, 7, 8, 9), signalling (30), hormone metabolism (17), stress (20), secondary metabolism (16), cell wall (10), redox (21), and silencing (27.5).

