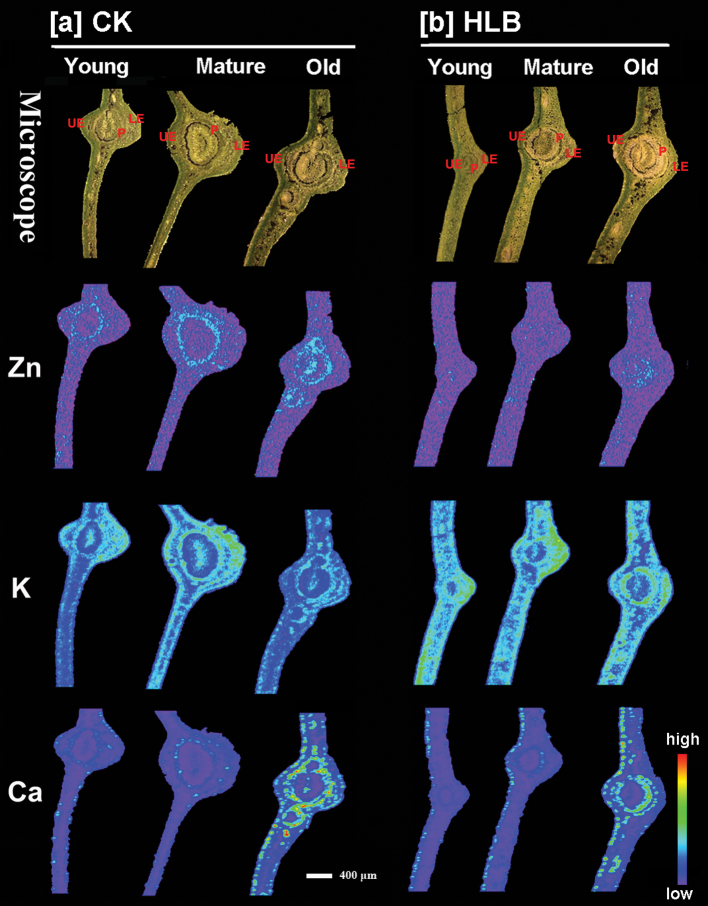
Fig. 3.
Micro-XRF mapping of elements (Zn, K, and Ca) in the cross-sections of young, mature, and old leaves collected from healthy (a) and HLB-affected (b) grapefruit plants. The number of fluorescence yield counts was normalized by I0 and the dwell time. The red colour, depicting elemental concentrations in each map, was scaled to the maximum value for each map. Scale bar: 400 µm. UE, upper epidermis; LE, lower epidermis; P, phloem.

