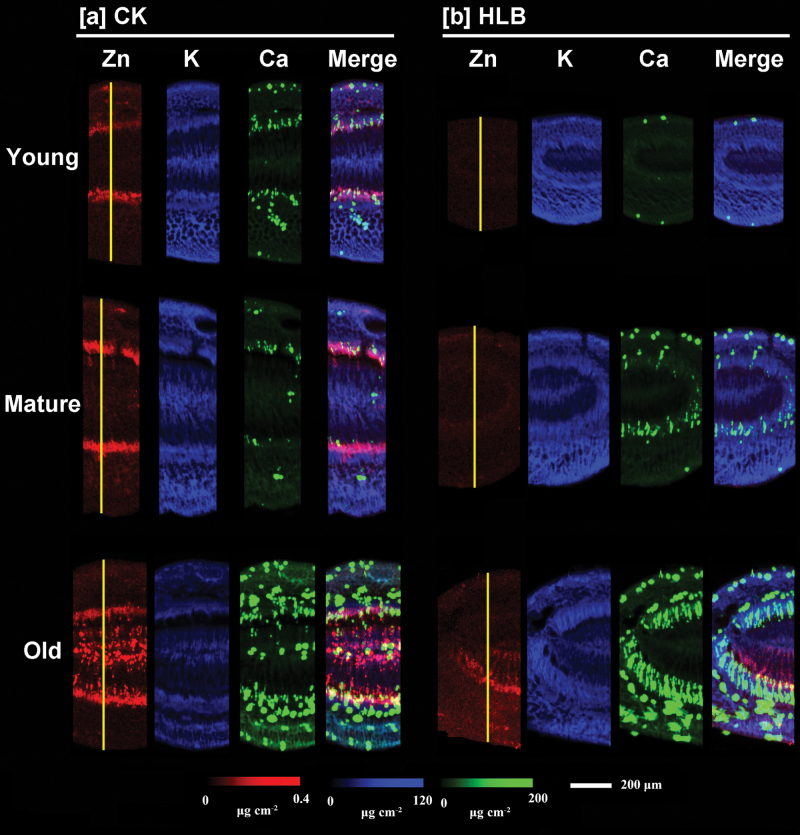
Fig. 5.
Micro-XRF mapping of Zn (red), K (blue), and Ca (green) in the cross-sections of young, mature, and old leaf blades collected from healthy (a) and HLB-affected (b) grapefruit plants. Fluorescence intensities of elements were normalized and subsequently translated to concentrations by using measurements of the standards. Pixel brightness is displayed in RGB, with the brightest spots corresponding to the highest concentrations (µg cm–2) for the element depicted. Scale bar: 200 µm.

