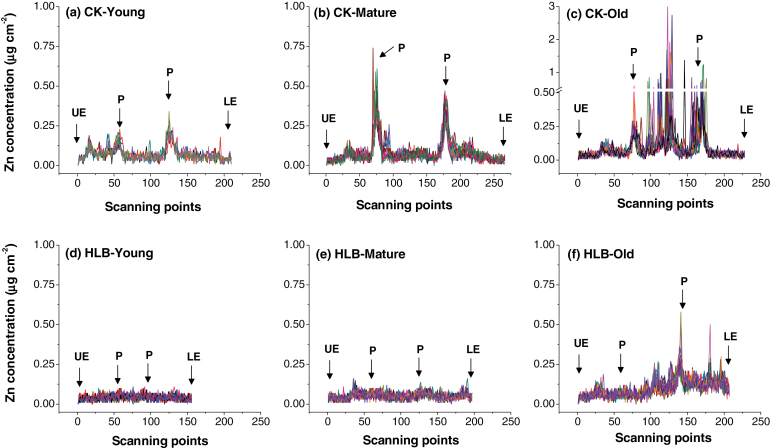
Fig. 6.
Zinc concentrations (µg cm–2) of the scanning sites selected to span the sections from the upper epidermis (UE) to the lower epidermis (LE) across the veins of young, mature, and old leaves collected from healthy (a, b, c) and HLB-affected (d, e, f) grapefruit plants. Note that the range of y-axis scale values in (c) is broken and, at its maximum, is three times that of the other scans. The selected scanning sites are marked by yellow lines in Fig. 4, with 10–14 different scanning lines selected for each plant sample. P, phloem.

