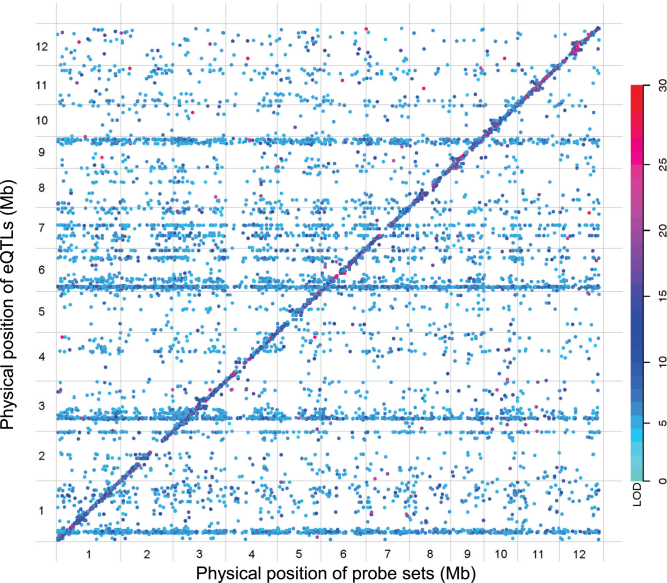
Fig. 1.
eQTLs identified using flag leaf tissue at the heading stage of RILs from a cross between Zhenshan 97 and Minghui 63. The positions of 13 647 eQTLs for 10 725 e-traits in the genome are shown. The x-axis shows the physical positions of expressed probe sets (e-traits) in the genome, and the y-axis the physical positions of eQTLs. Each dot represents an eQTL detected. The diagonal indicates possible cis-eQTLs, which are co-located with their corresponding probe sets. All the off-diagnal points indicate trans-eQTLs. The 12 rice chromosomes are separated by grey lines. The color key reflects the LOD scores (LOD scores >30 are set to 30). Most of the dots in higher scores are located in the diagonal representing cis-eQTLs. Multiple horizontal bands (trans-eQTL hotspots) are shown on four chromosomes (1, 3, 6, and 9), which suggests that transcript levels for many of the probe sets are associated with the polymorphisms in these regions. LOD scores >4.95 were adopted as the cut-off point for eQTLs.

