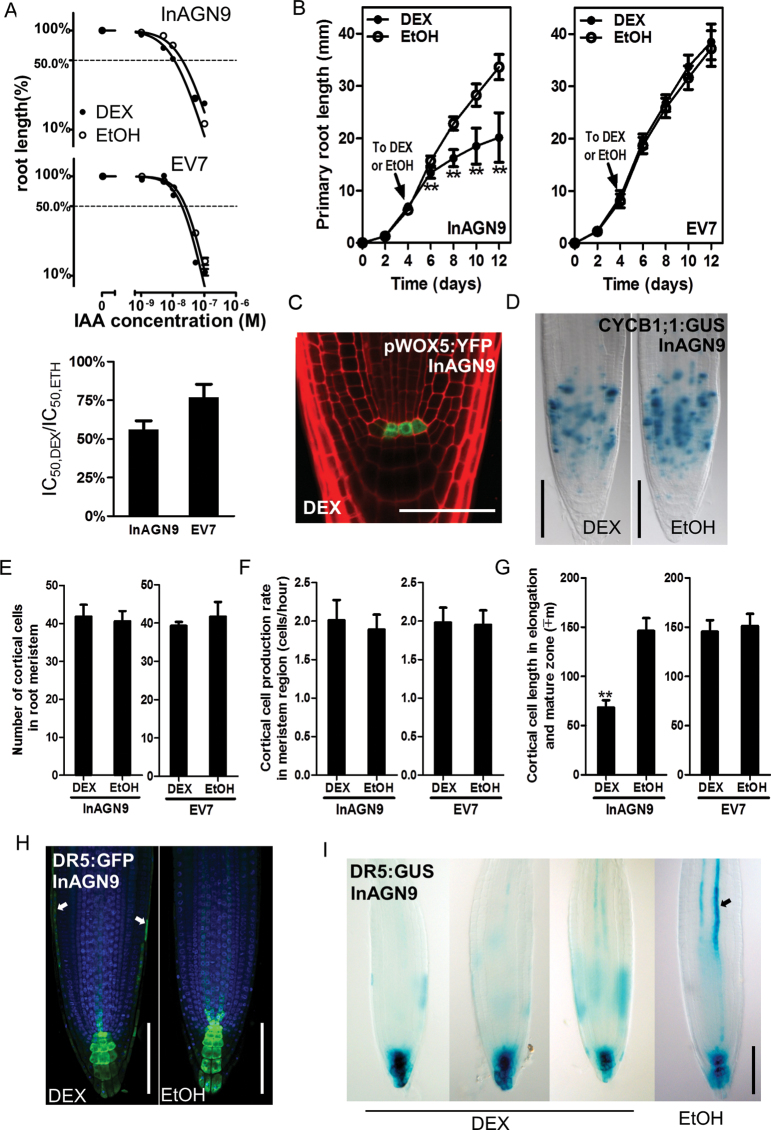
Fig. 2.
Disruption of auxin transport by DEX induction and the phenotypes of root tips. (A) In the presence of exogenous IAA, root elongation of InAGN9 and EV7 seedlings treated with DEX or EtOH is inhibited in an IAA concentration-dependent manner. EtOH indicates the uninduced control. Relative change of sensitivity to auxin after DEX induction is presented as a shift of the half-inhibition concentration (IC50) by calculating the IC50,DEX/IC50,EtOH ratio. Each data point represents the mean ±SE of 20–25 seedlings from duplicate experiments. (B) Growth curve of InAGN9 and EV7 roots. Seedlings were transferred to DEX- or EtOH-containing medium at day 4 (indicated by arrow). The mean ±SD for 18–20 seedlings from duplicate experiments is plotted. **P<0.01 (Student’s t-test). (C) Expression of pWOX5-YFP in the root tips of DEX-induced InAGN9 seedlings. (D) Expression of CYCB1;1:GUS in the root tips of DEX- or EtOH-treated InAGN9 seedlings. (E–G) Number of meristem cells (E), cell production rate in the cortical cell layer within the meristem zone (F), and cortical cell length in the differentiation zone (G) of DEX- or EtOH-treated InAGN9 seedlings. Data are presented as the mean ±SE from 43–45 seedlings in two or four repeated experiments. **P<0.01 (Student’s t-test). (H and I) DR5rev::GFP (H) and DR5::GUS (I) expression pattern in DEX- or EtOH-treated InAGN9 seedlings. Arrows in (H) show GFP signals in cells of the lateral root cap; the arrow in (I) shows GUS signal in stele tissue of EtOH-treated root tip. Scale bar=50 μm in (C), 100 μm in (D), (H), and (I).

