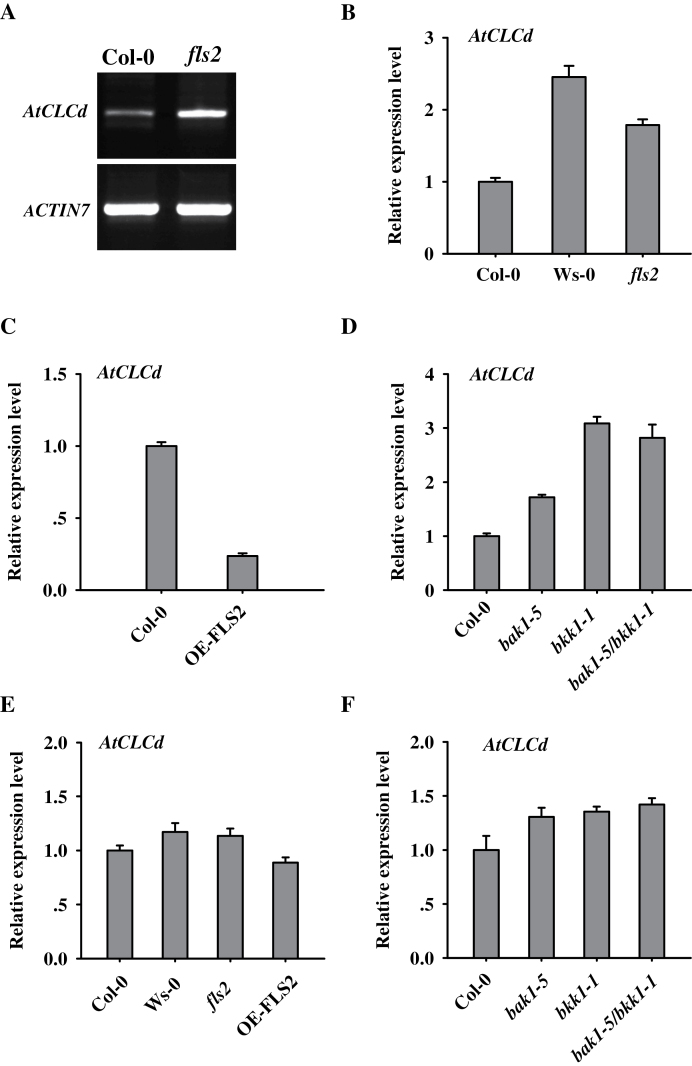
Fig. 6.
FLS2 and its signalling partners participate in regulating AtCLCd gene expression. (A) Expression of AtCLCd in Col-0 and fls2 mutant leaves analysed by semi-quantitative PCR. The level of ACTIN7 transcript was used as a loading control. (B–D) Expression of AtCLCd determined by quantitative RT–PCR in Col-0, Ws-0, and fls2 plants (B), in Col-0 and an FLS2-overexpressing line (OE-FLS2) (C), and in Col-0, bak1-5, bkk1-1, and bak1-5/bkk1-1 plants (D). (E and F) Expression levels of AtCLCd in Col-0, Ws-0, fls2, OE-FLS2 (E); and bak1-5, bkk1-1, and bak1-5/bkk1-1 (F) 14-day-old seedlings grown under sterile conditions. All samples were assayed in triplicate and normalized to ACTIN2. Error bars indicate the SD.

