Figure 1.
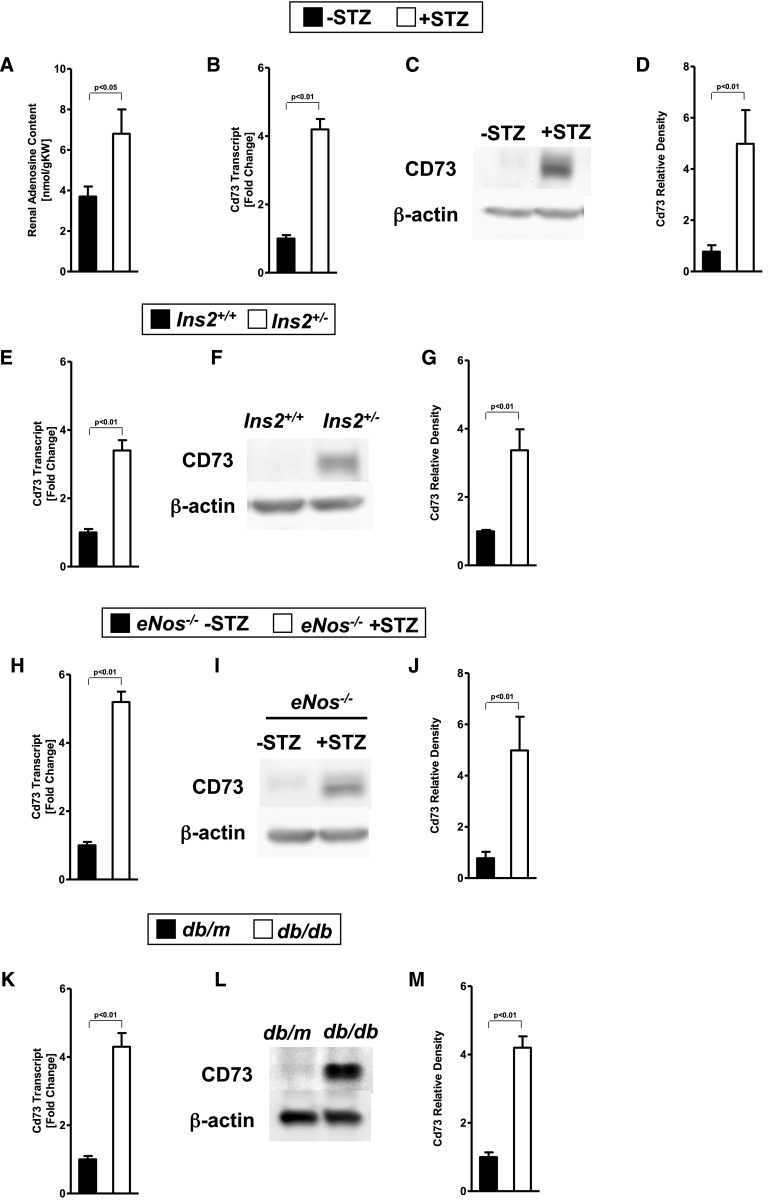
CD73 is induced by diabetic nephropathy. Age-, sex-, and weight-matched mice were subjected to STZ-induced diabetes for 16 weeks until organs were removed for analysis. (A) Wild-type mice show increased renal adenosine concentrations after 16 weeks of diabetes compared with wild-type controls without diabetes (n=3–4). Cd73 mRNA and CD73 protein renal tissue content (quantification by densitometry [n=3] was induced during diabetic nephropathy in (B–D) the STZ-induced diabetic model in wild-type mice, (E–G) Akita (Ins2+/−) mice, (H–J) STZ-induced eNOS−/− mice, and (K–M) db/db mice. Kidneys were excised, total RNA isolated, and Cd73 mRNA levels determined by real-time RT-PCR. Data were calculated relative to β-actin and are expressed as fold change compared with control (no diabetes)±SD (n=4). Renal CD73 protein levels were assessed by Western blot (β-actin to control loading conditions; one representative blot among 3 is shown) and quantification by densitometry (n=3). All data are shown as mean±SD.

