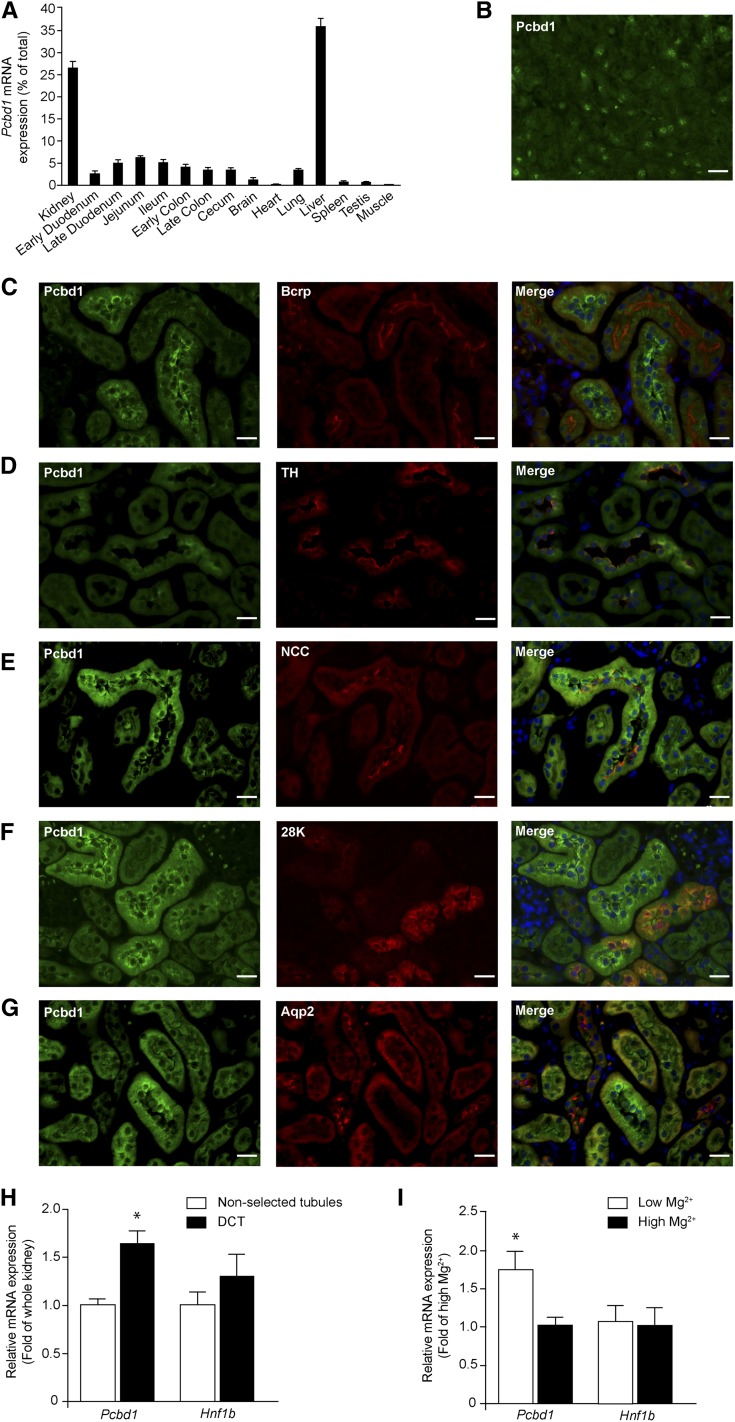
Figure 1.
Pcbd1 is expressed in the DCT of the kidney. (A) Tissue expression pattern of the Pcbd1 transcript. Pcbd1 mRNA expression level was measured in a panel of mouse tissues by quantitative RT-PCR and normalized for Gapdh1 expression. Data represent the mean of three individual experiments±SEM and are expressed as the percentage of the total tissue expression. (B) Immunohistochemical analysis of Pcbd1 in mouse pancreas tissue. Scale bar, 20 μm. (C–G) Mouse kidney sections were costained for Pcdb1 (green) and (C) Bcrp (red), (D) TH (red), (E) NCC (red), (F) 28K (red), or (G) Aqp2 (red). Nuclei are shown by 4′,6-diamidino-2-phenylindole staining (blue). TH, Tamm Horsfall; 28K, calbindin-D28K. Scale bar, 20 μm. (H) Kidney expression pattern of Pcbd1 shows the highest expression in DCT. The mRNA expression levels of Pcbd1 and Hnf1b in (black bars) COPAS-selected mouse DCT and (white bars) control (nonselected) kidneys were measured by quantitative RT-PCR and normalized for Gapdh expression. Data represent the mean of three individual experiments±SEM and are expressed as fold difference compared with the expression in nonselected tubules. *P<0.05 versus total kidney. (I) DCT expression of Pcbd1 is regulated by dietary Mg2+ intake. The mRNA expression levels of Pcbd1 and Hnf1b in COPAS-selected mouse DCT kidney tubules from mice fed with (white bars) low and (black bars) high Mg2+-containing diets were measured by real-time RT-PCR and normalized for Gapdh expression. Data represent the mean of four individual experiments±SEM and are expressed as fold difference compared with the expression in high Mg2+-containing diets. *P<0.05 versus high Mg2+. Aqp2, aquaporin 2; Bcrp, breast cancer resistance protein.

