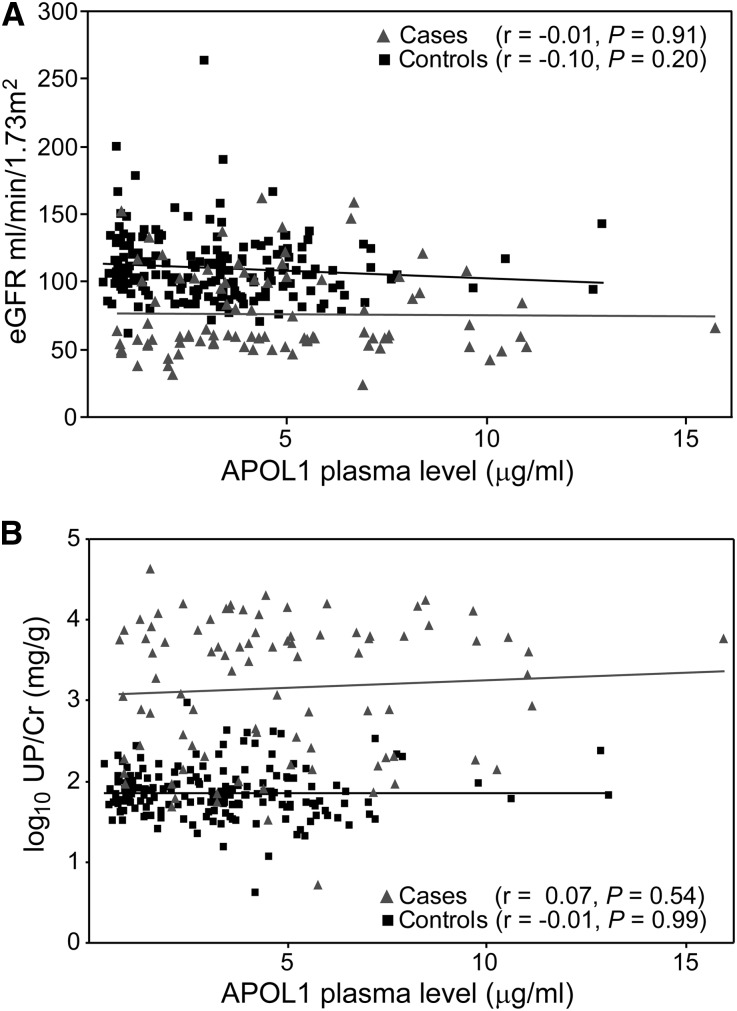
Figure 1.
APOL1 plasma levels did not correlate with eGFR or proteinuria. Scatter plots of APOL1 plasma levels relative to (A) eGFR or (B) UP/Cr in all participants (cases and controls combined). Linear regression trend lines are shown; Pearson correlation coefficients (r) and P values are presented in key.

