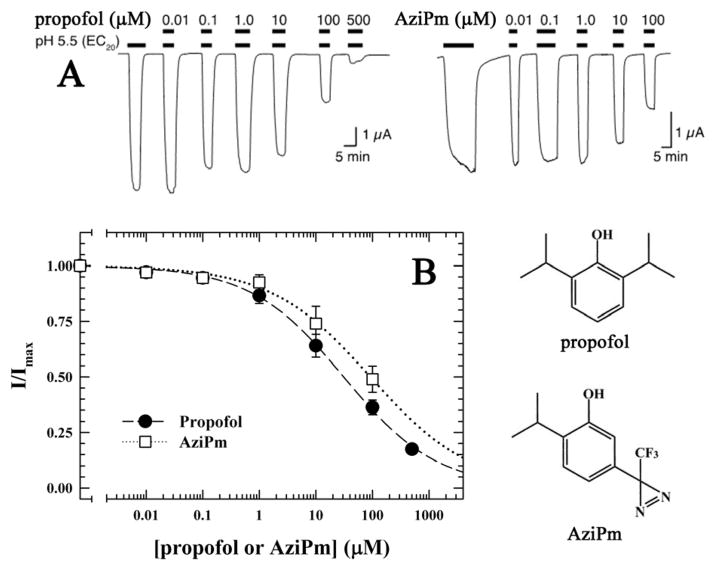
Figure 1. Propofol and AziPm both inhibit H+ activated GLIC currents.
A) Representative current traces of oocyte-expressed GLIC exposed to pH 5.5 corresponding to the EC20 in the presence of various concentrations of propofol or AziPm as indicated with black bars over the traces. Limited solubility of AziPm prevented analysis at higher concentrations. B) Inhibition curves for propofol and AziPm at the pH corresponding to the EC20 (pH 5.5). Response is expressed as the fraction of current induced in the presence of the indicated concentrations of propofol (●) or AziPm (□) relative to that in their absence. The data (n=7) were fit to Hill equations with IC50s of 21.4 ± 1.2 and 51.4 ± 5.3 μM, respectively, and had Hill coefficients of −0.67 ± 0.05 and −0.63 ± 0.11, respectively. Error bars represent SEM. Also included are the chemical structures of propofol and AziPm.

