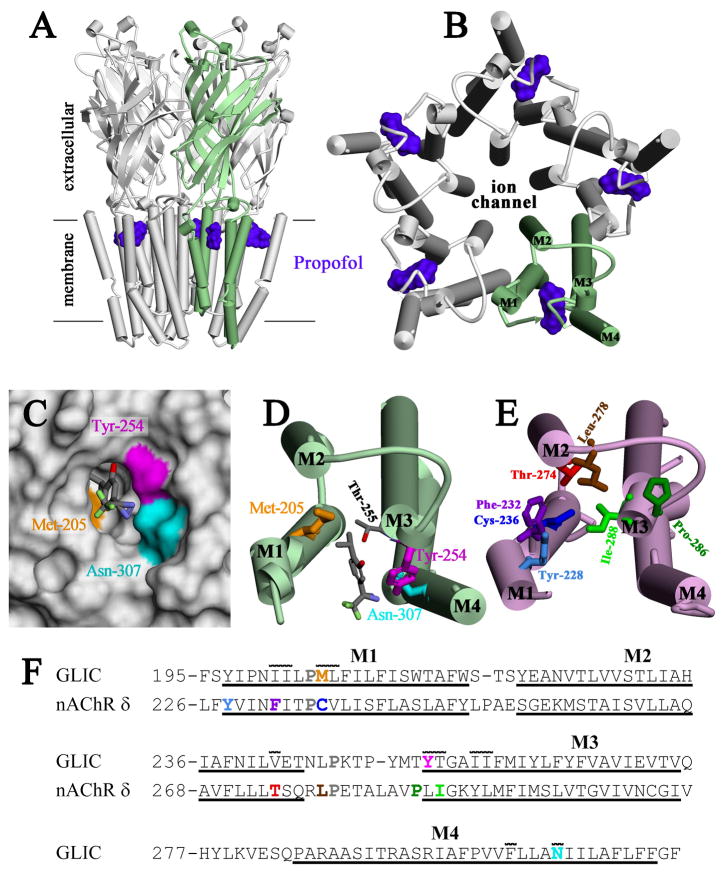
Figure 4. Location of [3H]AziPm-photolabeled residues in the propofol binding site in GLIC and in the equivalent binding site in the Torpedo nAChR δ subunit.
Shown in panels A–D are views of the crystallographic model of GLIC co-crystalized with propofol (PDB:3P50) and in panel E a view of the nAChR δ subunit transmembrane domain (TMD) from an nAChR homology model derived from the GLIC structure (see Methods and Supporting Information Supplemental Figures S1 and S2). α-Helices are shown as cylinders and β-sheets as ribbons. A) A view of GLIC from the side and B) a view of the GLIC TMD from the base of the extracellular domain, with one subunit colored green. The positions of propofol within the structure are shown as Connolly surfaces (purple). C) Connolly surface representation of the propofol binding pocket, viewed from the lipid, with the surfaces contributed by the photolabeled residues color-coded: Tyr-254 (magenta), Asn-307 (cyan), and Met-205 (gold). The lowest energy docking solution for AziPm is included in stick format, color-coded by atom type: gray, carbon; red, oxygen; blue, nitrogen; light green, fluorine. D) A view of a single subunit’s TMD from the same perspective as in B, illustrating the position of the docked AziPm solution and the [3H]AziPm-photolabeled residues in stick format, color-coded as in C. The propofol/AziPm binding pocket resides between the M1, M3 and M4 helices. E) A view of the nAChR δ subunit TMD, oriented similar to GLIC in D. Residues in the δ subunit helix bundle pocket photolabeled by various photoreactive nAChR inhibitors are shown in stick format: [3H]AziPm Phe-232, Cys-236, & Thr-274 (20); [14C]halothane δTyr-228 (33); [125I]TID Ile-288, Phe-232, Cys-236, Thr-274, & Leu-278 (27,34,35); [3H]benzophenone Pro-286, Ile-288, & Phe-232 (28); [3H]azietomidate Cys-236 (41); and [3H]TFD-etomidate Phe-232 & Cys-236 (29). In contrast to the propofol/AziPm site in GLIC, the drug binding pocket in the nAChR δ subunit resides between the M1, M2, & M3 helices. F) The subunit primary structure alignment in the M1–M3 region used to make the nAChR homology model from the GLIC structure. The conserved prolines in all pLGICs are shown in gray. Also included is the M4 sequence from GLIC. The extent of the transmembrane helices is denoted by underlining. Photolabeled residues in GLIC and the Torpedo nAChR δ subunit are color-coded as in D & E. Residues in GLIC in contact with propofol in the crystal structure (10) have a line over them, illustrating the similarities between the intrasubunit pockets of GLIC and Torpedo nAChR δ subunit.

