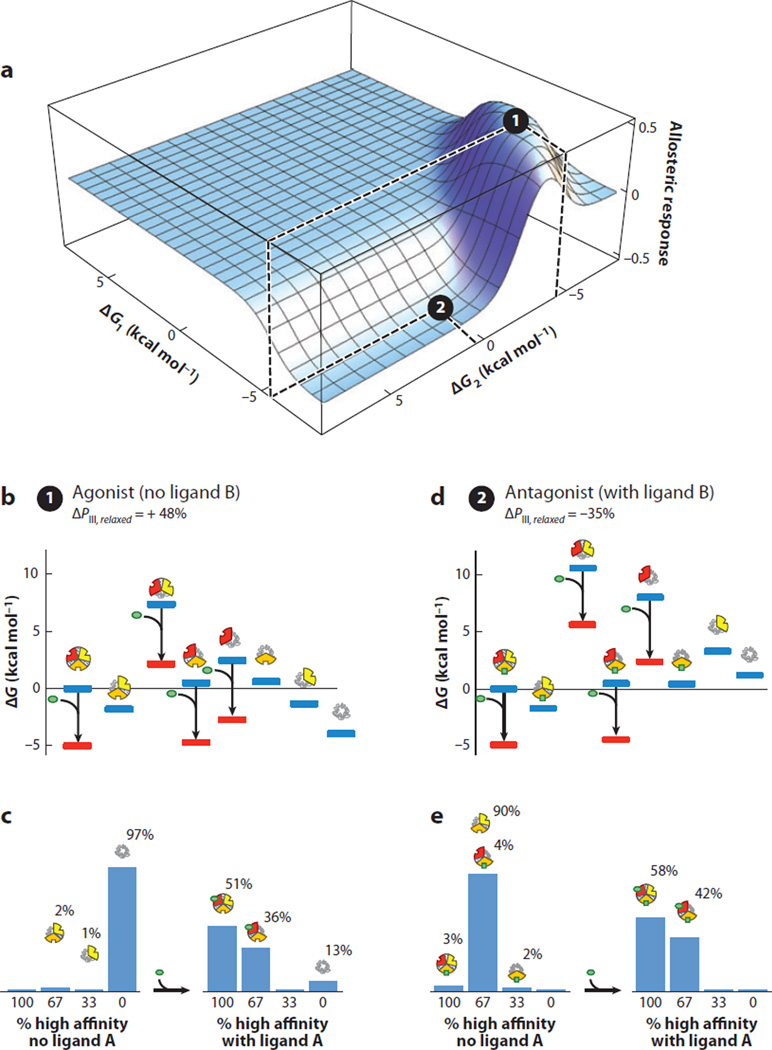
Figure 7.
A specific combination of parameters for the three-domain ensemble allosteric model (EAM) reveals agonist and antagonist properties co-occurring in the same molecule. (a) A specific combination of parameters consistent with agonism-antagonism is indicated by the black circles: Δg12 = 6.8, Δg23 = 4.8, Δg13 = −1.9, ΔG1 = −6.75, ΔG2(2) = 0.6, ΔG2(1) = −4.4, and ΔG3 = −2.7 (all values in kcal mol−1). The allosteric response is the change in probability of domain III being in the high-affinity R state upon addition of ligand A. Position 1 (black circle at local maximum) exhibits agonistic response to ligand A in the absence of ligand B. Position 2 (black circle at local minimum) exhibits antagonistic response to ligand A in the presence of ligand B. (b) Ensemble microstate energies of the agonistic example, evaluated using Figure 6b and the parameters listed above. Blue bars indicate energy levels in the absence of ligand A (green ovals), and red bars indicate energy levels in the presence of ligand A. (c) Populations of folded domains for the agonistic model in the absence (left) and presence (right) of ligand A. The population of folded domain III rises from 3% to 51%, as indicated. (d) Ensemble microstate energies of the antagonistic example, evaluated using Figure 6b and the parameters listed above. Blue bars indicate energy levels in the absence of ligand A (green ovals), and red bars indicate energy levels in the presence of ligand A. (e) Populations of folded domains for the antagonistic model in the absence (left) and presence (right) of ligand A. The population of high-affinity domain III decreases from 93% to 58%, as indicated.

