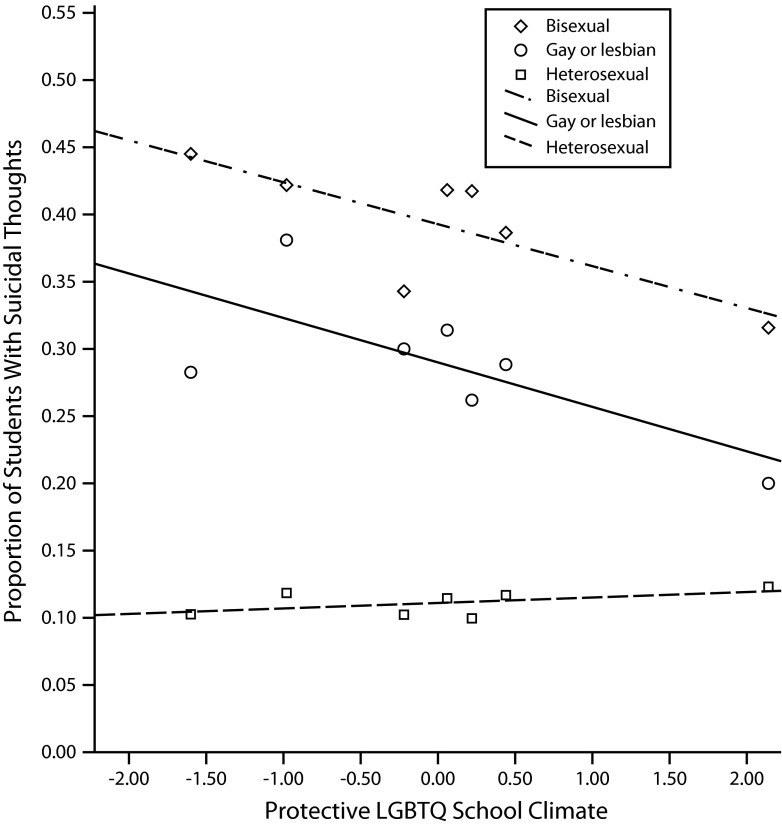
FIGURE 1—
Relationship between suicidal thoughts and protective school climates, by sexual orientation status: Youth Risk Behavior Surveillance Surveys, United States, 2005 and 2007.
Note. LGBTQ = lesbian, gay, bisexual, transgender, and questioning. The x-axis depicts protective school climates for sexual minority youths. Values represent standardized z scores for the 8 items from the School Health Profile Survey. A score of 0 indicates an average school climate across the 8 localities. Negative scores indicate school climates that are less protective for LGBTQ youths; conversely, positive scores indicate more protective school climates for LGBTQ youths. The figure depicts both raw values as well as the regression lines fit by sexual orientation groups.

