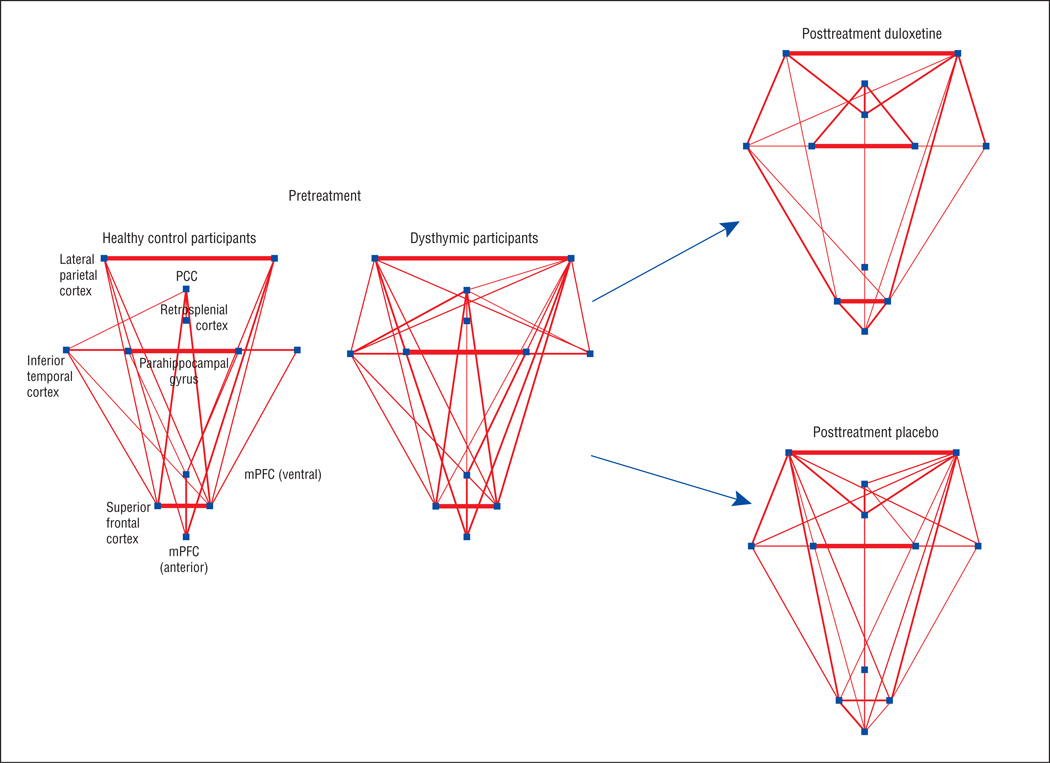
Figure 2.
Graphical presentation of the default mode network (DMN). Pretreatment magnetic resonance imaging scans were obtained in participants with dysthymic disorder (N = 41) and matched healthy control subjects (N = 25). Posttreatment magnetic resonance imaging scans were obtained following a 10-week clinical trial of duloxetine vs placebo. The dots represent DMN regions and the lines represent functional connections (threshold z >0.2); line width corresponds to the connection strength. Qualitatively, in the pretreatment scans, the DMN demonstrates more and stronger connections in the dysthymic vs healthy control participants. Statistical comparison using graph theory (network density) bears out this observation (see Table 2). Posttreatment scans demonstrate a treatment × time interaction (F1,29 = 5.0; P = .03), driven by a greater reduction in DMN connectivity in the duloxetine-treated vs placebo-treated participants (N = 15 and N = 17, respectively). PCC indicates posterior cingulate cortex.

