
Fig. 3. Resistance to PI3K inhibition induced by mTORC1 activation.
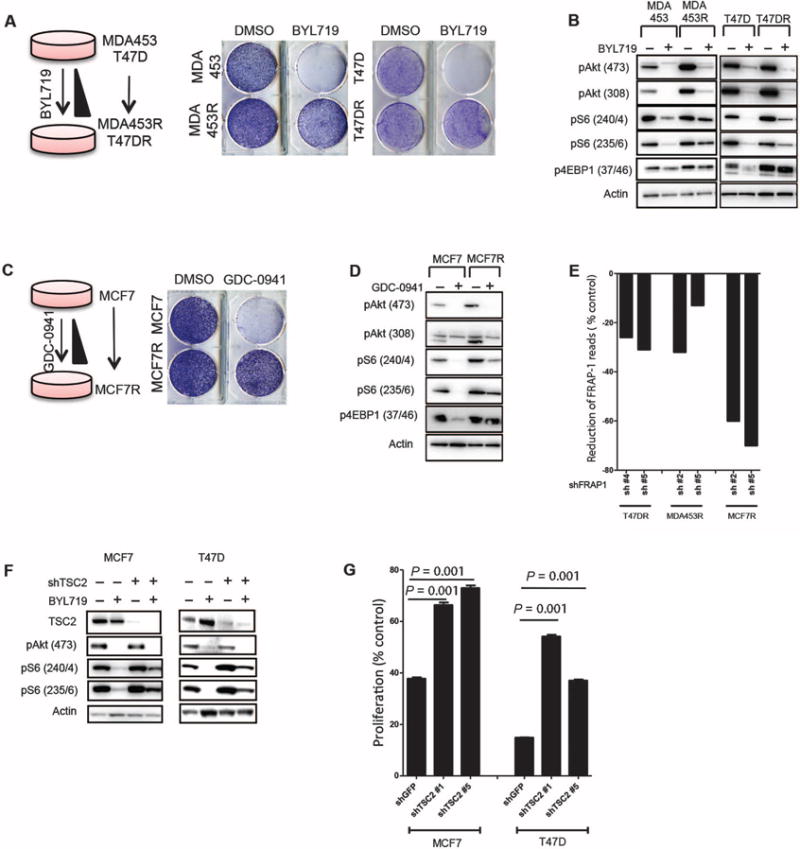
(A) Generation of MDA453 and T47D cell lines with acquired resistance to BYL719. (Right) Proliferation of parental and resistant (MDA453R and T47DR) cells in the presence of 1 μM BYL719. (B) Immunoblotting analysis of phosphorylated proteins in parental, MDA453R, and T47DR cell lines after 24 hours of treatment with 1 μM BYL719. (C) Generation of MCF7 cell line with acquired resistance to GDC-0941. (Right) Proliferation of parental and resistant (MCF7R) cells in the presence of 1 μM GDC-0941. (D) Immunoblotting analysis of phosphorylated proteins in MCF7 and MCF7R after 24 hours of treatment with 1 μM GDC-0941. (E) Reduction in the number of reads by individual FRAP1 shRNAs transfected into drug-resistant cells after 7 days of treatment with either BYL719 or GDC-0941 [normalized to dimethyl sulfoxide (DMSO)–treated controls]. (F) Immunoblotting analysis of phosphorylated proteins in MCF7 and T47D cells after knockdown of TSC2 with shTSC2 and treatment with 1 μM BYL719 for 2 hours. (G) Proliferation assay of MCF7 and T47D cells after TSC2 knockdown with shTSC2 in the presence of 1 μM BYL719 for 4 days. Graph shows one representative experiment of two performed. Data are means ± SEM. P value was calculated using two-sided Student's t test.