
Fig. 4. Correlation between pS6(240/4) inhibition and clinical response to BYL719 in breast cancer patients.
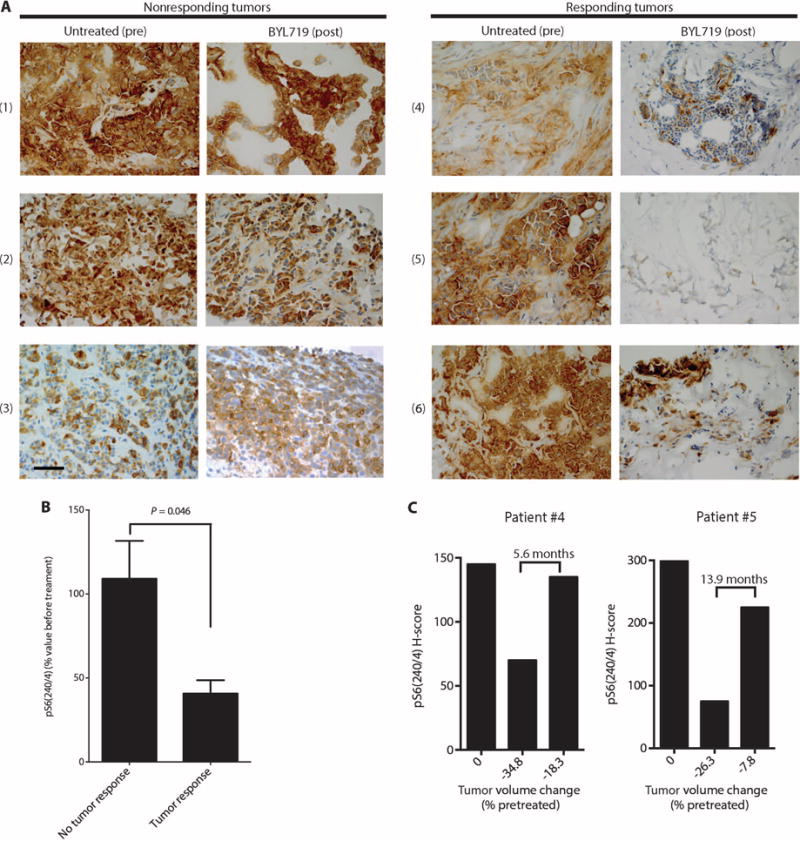
(A) Representative sections stained by IHC for pS6(240/4) in paired biopsies obtained from tumors of patients before (untreated) and at day 28 of BYL719 treatment. Patient numbers are indicated at left in parentheses. Images were captured at ×40 magnification; scale bar, 100 μm. (B) Differences in pS6(240/4) inhibition by BYL719 between the nonresponder (n = 3) and responder (n = 3) patients. pS6(240/4) was quantified in all the tumor cells present in the pretreatment biopsies and upon BYL719 treatment for each patient. (C) Levels of pS6(240/4) in tumor samples from patients 4 and 5 collected before initiation of BYL719 therapy (left bars), at 28 days after therapy initiation (middle bars), and at disease progression (right bars). Below the bars, the change in tumor volume (% of pretreatment size) by RECIST criteria is indicated at each time point.