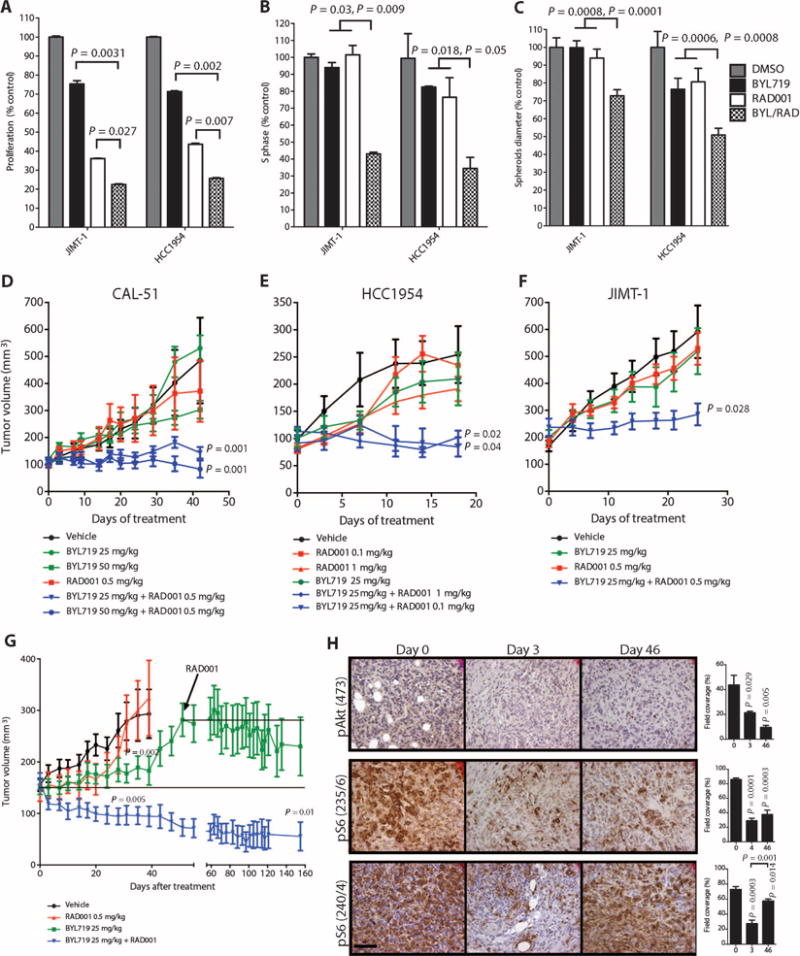
Fig. 5. Antitumor effects of combined mTORC1 (RAD001) and p110α (BYL719) inhibition.

(A) Proliferation of the BYL719-resistant JIMT-1 and HCC1954 cell lines in the presence of BYL719 (0.5 μM), RAD001 (1 nM), or the combination for 72 hours. (B) Cell cycle analysis of JIMT-1 and HCC1954 cells with BYL719 (0.5 μM), RAD001 (1 nM), or the combination for 48 hours. (C) Spheroid size of JIMT-1 and HCC1954 cells treated with BYL719 (1 μM), RAD001 (10 nM), or the combination for 48 hours. In vitro experiments were in triplicates and repeated three times. (D) Tumor growth curves of BYL719-resistant CAL51-derived xenografts treated with RAD001 (0.5 mg/kg), BYL719 (50 or 25 mg/kg), or the described combinations (n = 10 for each treatment condition). (E) Tumor growth curves of BYL719-resistant HCC1954 cell–based xenografts treated with BYL719 (25 mg/kg), RAD001 (0.1 or 1 mg/kg), or the described combinations (n = 10 for each treatment condition). (F) Tumor growth curves of BYL719-resistant JIMT-1 cell–based xenografts treated with RAD001 (0.5 mg/kg), BYL719 (25 mg/kg), or the described combination (n = 10 for each treatment condition). (G) Tumor growth curve of BYL719-sensitive MCF7-derived xenografts treated as indicated with BYL719 (25 mg/kg), RAD001 (0.5 mg/kg), or the combination of both. RAD001 was added to the BYL719-treated cohort at day 46 (n = 10 for each treatment condition). (H) An average of 6 to 15 images of two to four independent tumors was used to quantify IHC for pAkt and pS6 on days 0, 3, and 46 of BYL719 treatment. Quantification of IHC was performed with CellProfiler and is shown in bar graphs to the right of each panel. Images were captured at ×40 magnification; scale bar, 100 μm. Data are means ± SEM. P value was calculated using two-sided Student's t test.
