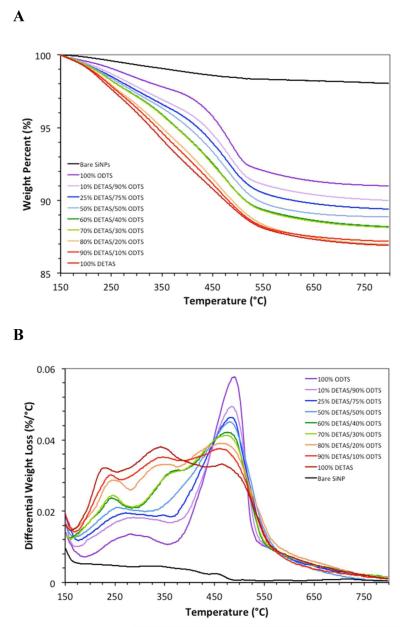
Figure 1.
Thermal analysis of SiNPs displayed as (A) the weight percent lost and (B) the differential thermal analysis. Samples were functionalized with: 100% DETAS (dark red), 95% DETAS (red), 88% DETAS (orange), 81% DETAS (lime-green), 73% DETAS (dark green), 65% DETAS (light blue), 39% DETAS (blue), 17% DETAS (lavender), 100% ODTS (violet), and bare (black). Data was normalized to 100% at 150 °C for each sample.

