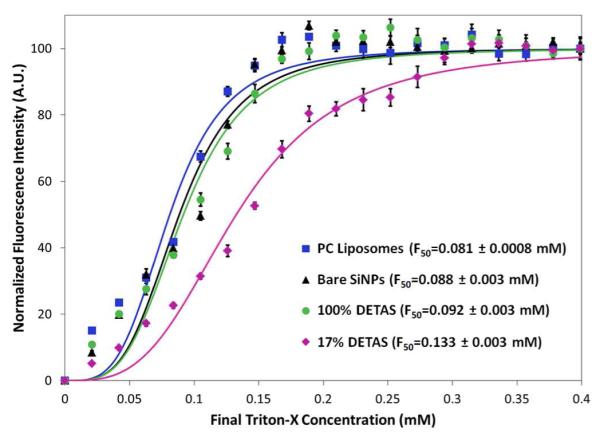
Figure 5.

Fluorescence measurements to determine PC bilayer stability to Triton-X. Data was fitted with non-linear regression and the F50 values were calculated as the concentration of Triton-X that resulted in 50% drop in fluorescence intensity. Maximum absolute fluorescence was subtracted to 0 A.U. at 0 mM and normalized to 100 A.U. at 0.4 mM. Mean ± SD, n = 5.
