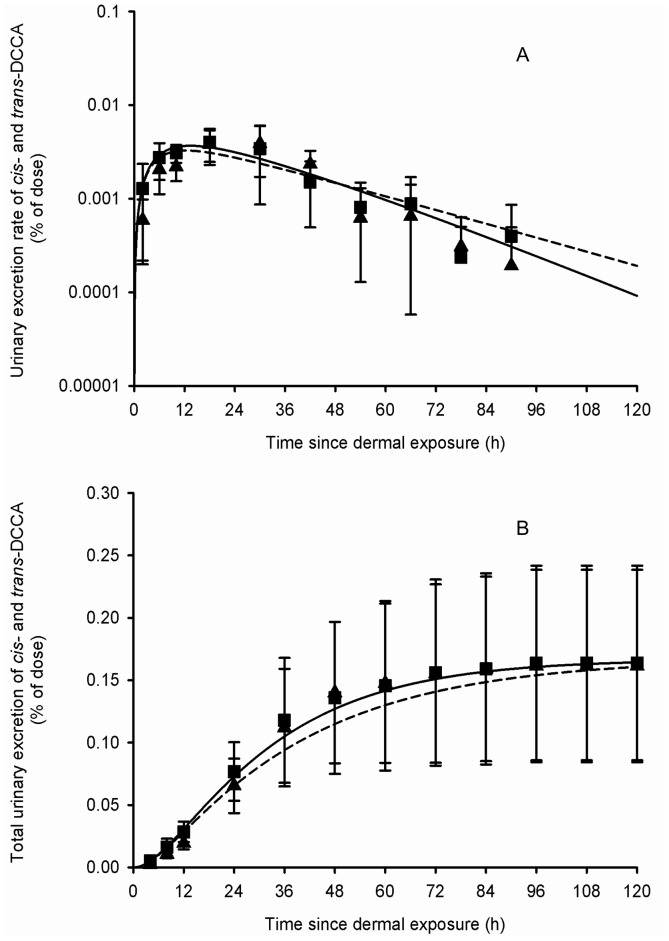
Figure 5. Comparison of model simulations with experimental data for cis- and trans-DCCA (volunteers dermally exposed).
Comparison of model simulations (lines) with experimental data of Woollen et al. (1992) (symbols) on the average time courses of cis- and trans-DCCA excretion rate (A) and cumulative excretion (B) (% of applied dose) in volunteers dermally exposed to 31 mg of cypermethrin. Triangle and square symbols represent average experimental values for cis- and trans-DCCA, respectively, and vertical bars the experimental standard deviation (n = 6).

