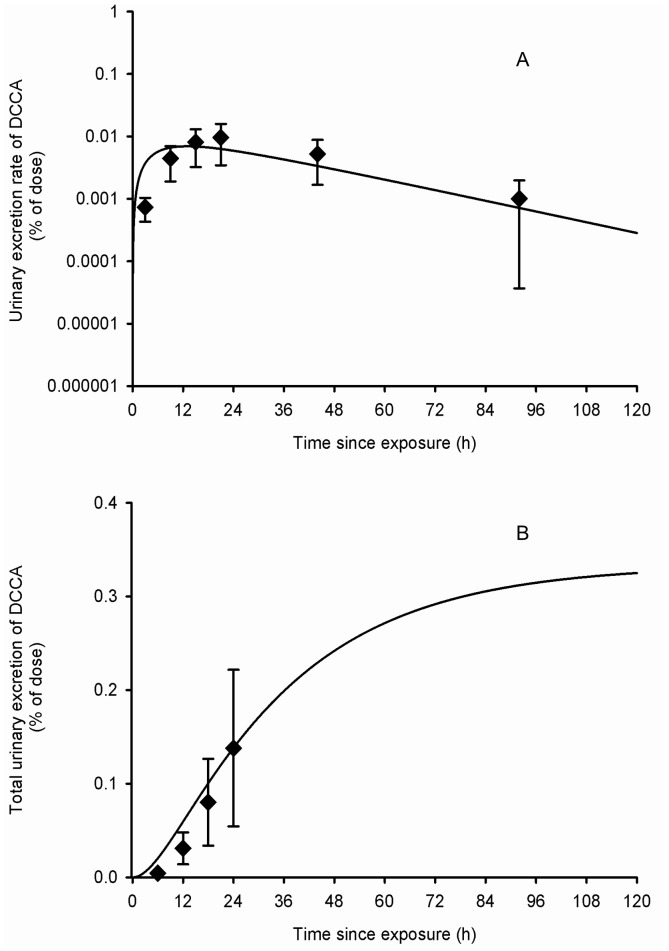
Figure 7. Comparison of model simulations with experimental data for DCCA (volunteers dermally exposed).
Comparison of model simulations (lines) with experimental data of Tomalik-Scharte et al. (2005) (symbols) on the average time courses of DCCA excretion rate (A) and cumulative excretion (B) (% of applied dose) in healthy volunteers following a whole-body dermal application of a cream containing 3 g of permethrin. Diamond symbols represent average experimental values and vertical bars the experimental standard deviation (n = 6).

