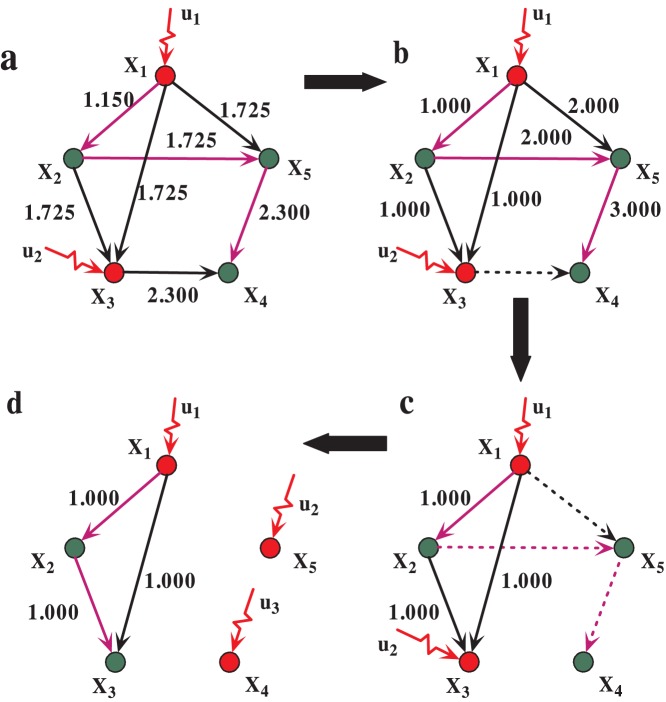
Figure 1. Demonstration of the controllability of network in cascading failure.
The network with size  and
and  , the green nodes are matched nodes and the red ones are unmatched. The purple edges are matching edges in maximum matching. However, the unmatched nodes
  ,
,  are the driver nodes which should be controlled directly by the inputs
  and
and  , and after the edges failure, the unmatched nodes
  ,
,  ,
,  should be controlled by inputs
  ,
,  and
and  . The red and green circles symbol the unmatched nodes and matched nodes, respectively. The purple lines symbol edges in maximum matching, and the dash lines symbol the failed edges in cascades. The red arrows symbol the input signals. The process of a,b,c,d shows the change of controllability in cascading failure.

