
Figure 2. The number of driver nodes and size of SCC for ER networks with different average degrees when the highest load edge is removed.
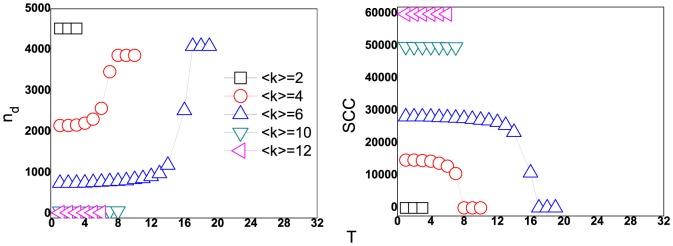
(a) the number of driver nodes at different stages of the cascading failure; (b) the amount of edges in SCC at different stages of the cascading of failure. The networks size  and tolerant parameter
  . The squares, circles, triangles, lower triangles and left triangles symbol the controllability of ER networks with the average degrees
  respectively.