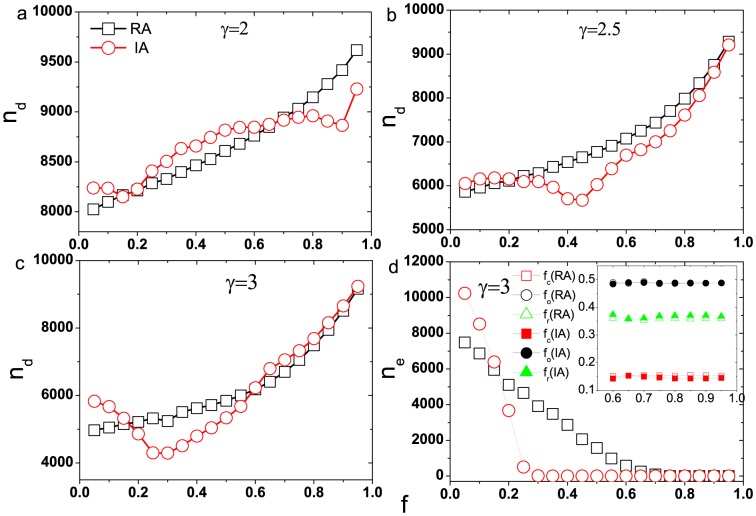
Figure 5. The number of driver nodes as a function of removal fraction  for SF network under different attacks.
(a)  , (b)
, (b)  , (c)
, (c)  , (d) the amount of failed edges in cascades as a function of removal fraction
  for
for  . The inset of (d) shows the densities of three categories edges in all failed edges with the increasing of
  for
for  . The networks size
  ,
,  and tolerant parameter
  . Each data point result is obtained by averaging over
  different realizations. The squares symbol the random attack and the circles symbol the intentional attack. In the inset of Fig. 5(d), the squares, circles and triangles symbol the critical, ordinary and redundant edges respectively. The open symbols and solid symbols represent the amount of edges under random and intentional attack respectively.

