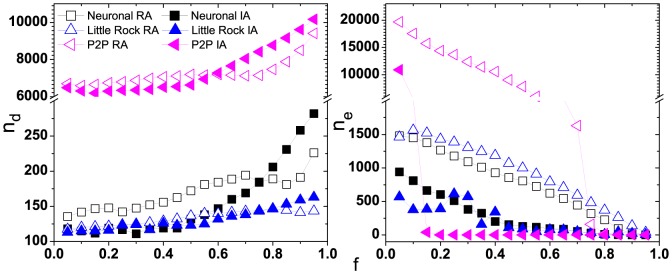
Figure 6. The results of cascading failure for several real networks: Internet p2p network, Neural network of Caenorhbditis elegans and Food web in Little Rock lake.

(a) The number of driver nodes as a function of removal fraction  under two attack strategies, (b) The amount of failed edges in cascades as a fraction of
  . The squares, triangles and left triangles symbol the Neural network of Caenorhbditis elegans, the Food web in Little Rock lake and the Internet p2p network respectively. The open symbols and solid symbols represent the controllability of networks under random and intentional attack respectively.
