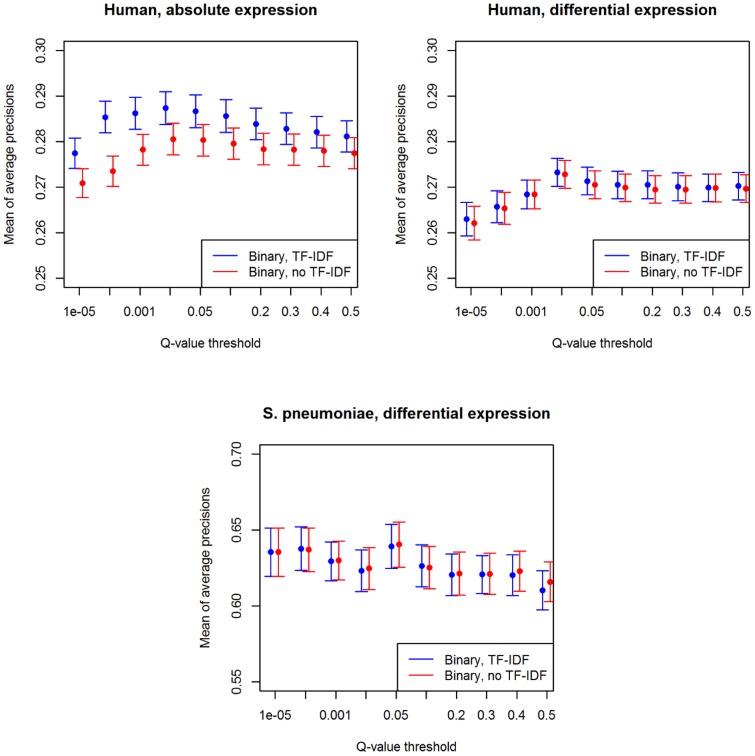
Figure 3. Retrieval performance according to  -value threshold.
Mean and standard error of the AP scores when a  -value threshold is used. For each data set, we display the performance for two alternatives of our framework, namely with or without the TF-IDF step. Notice that, for every
  -value threshold (x-axis), the two framework alternatives are displayed side-by-side.

