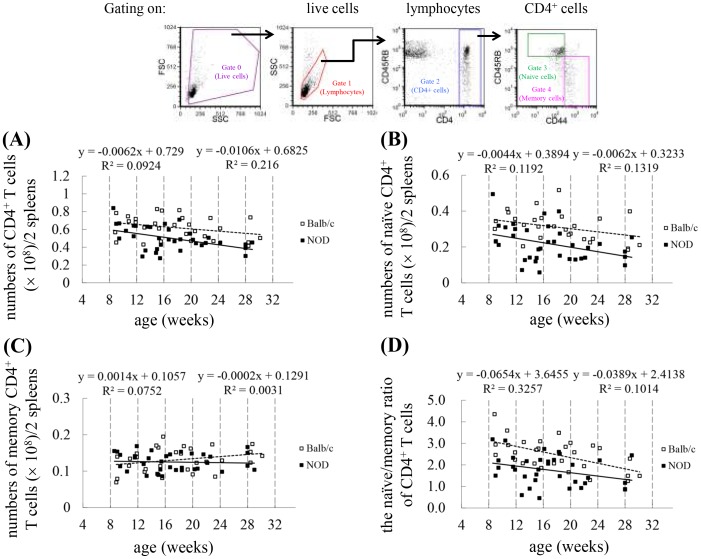
Figure 2. Reduction in naïve cells but not in memory cells in splenic CD4+ T cells of NOD mice compared to Balb/c mice.
Splenocytes isolated from Balb/c and NOD mice were stained with PE-Cy5-conjugated anti-CD4, FITC-conjugated anti-CD44, and PE-conjugated anti-CD45RB. Gating was performed on live CD4+ T cells. Naïve cells were defined as the CD45RB+CD44− phenotype, whereas memory cells were defined with CD45RB−CD44+. Dot plots are shown for the number of CD4+ T cells (A), the number of naïve CD4+ T cells (B), the number of memory CD4+ T cells (C), and the ratio of naïve/memory cells in CD4+ T cells (D) in the spleen of Balb/c and NOD mice. The results of each experiment were obtained from 2 pooled spleens (Balb/c: n = 58 mice; NOD: n = 68 mice, 4 spleens at 28 weeks old). Shown on the top is the gating strategy used in the analysis of the cell numbers of various T cell subsets. The number of cells in each T cell subset was calculated by multiplying their percentages in the spleen by the total cell number of splenocytes. The regression equation is shown in each panel (left: Balb/c; right: NOD).

