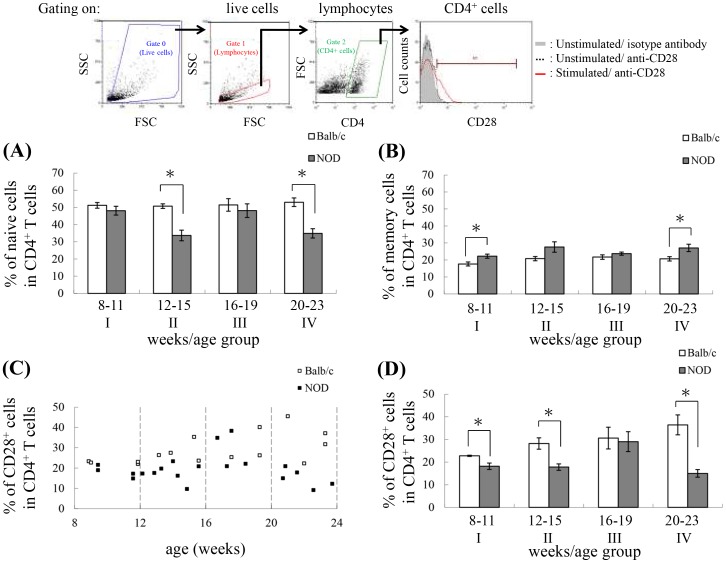
Figure 3. Correlation between age and CD28 expression on CD4+ T cells.
(A, B) The bar plots show the percentage of naïve CD4+ T cells (A) and memory CD4+ T cells (B) in each age group (age group I: Balb/c: n = 14 mice; NOD: n = 16 mice; age group II: Balb/c: n = 14 mice; NOD: n = 18 mice; age group III: Balb/c: n = 10 mice; NOD: n = 16 mice; age group IV: Balb/c: n = 10 mice; NOD: n = 10 mice). Data are shown as mean ± SEM. (C, D) Splenocytes isolated from Balb/c and NOD mice were stimulated with Con A, harvested, and stained with APC-conjugated anti-CD4 and FITC-conjugated anti-CD28 antibodies, and then 30,000 cells were analyzed by flow cytometry with gating performed on live CD4+ T cells. Shown on the top is the gating strategy used in the analysis of the percentage of CD28+ cells in the CD4+ T cell population. (C) The dot plot represents the percentage of CD28+ cells in the CD4+ T cell population with age. Each data point is taken from pooled data for 2 spleens (Balb/c: n = 30 mice; NOD: n = 40 mice). (D) The bar plot shows the percentage of CD28+ cells in the CD4+ T cell population broken down by age group (age group I: Balb/c: n = 8 mice; NOD: n = 8 mice; age group II: Balb/c: n = 8 mice; NOD: n = 14 mice; age group III: Balb/c: n = 6 mice; NOD: n = 8 mice; age group IV: Balb/c: n = 8 mice; NOD: n = 10 mice). Data are shown as mean ± SEM. *The values for NOD mice were significantly different from the values for Balb/c mice at P<0.05.

