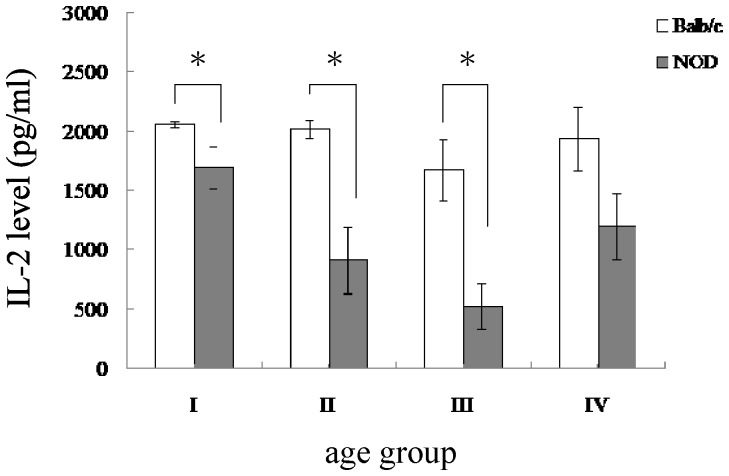
Figure 4. Reduced IL-2 production from splenocytes of NOD mice compared to age-matched Balb/c mice.
The bar plots show the IL-2 level in each age group. Data are shown as mean ± SEM (Balb/c: n = 8−10 mice per group; NOD: n = 8−10 mice per group). Splenocytes isolated from Balb/c and NOD mice were stimulated with Con A and culture supernatants were harvested to determine IL-2 levels. *The values for NOD mice were significantly different from the values for Balb/c mice at P<0.05.

