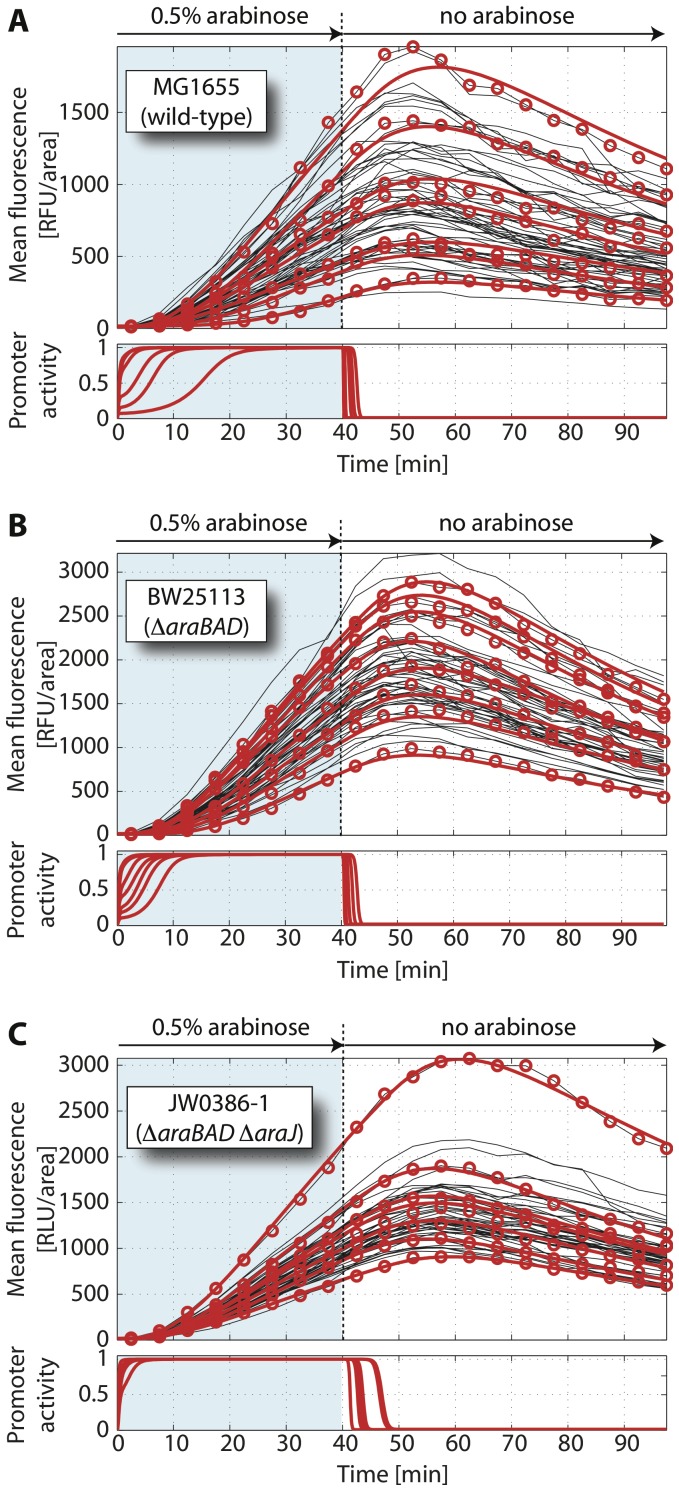
Figure 3. Single-cell response dynamics of the ara system upon arabinose down-shift.
Initially, cells of strain MG1655 (A, native ara regulation), BW25113 (B, ΔaraBAD) and JW0386-1 (C, ΔaraBAD and ΔaraJ) containing the reporter plasmid pBAD24-GFP (gfpmut3 under the control of the PBAD promoter) were prepared in the on-state by induction with 0.5% arabinose for 40 min. At this time arabinose was removed by flushing the microfluidic channel with fresh medium without arabinose. (upper panels) Black lines are experimental fluorescence trajectories, the red circles highlight the data for representative cells, and the bold red lines correspond to the corresponding fits by the model [Eqs. (1)–(7)] under pulsed addition of arabinose. FU: fluorescence units. (lower panels) Red lines show the corresponding dynamics of PBAD promoter activities in individual cells as inferred from the model. Number of evaluated cells: 62 (strain MG1655), 55 (strain BW25113), 51 (strain JW0386-1). For corresponding dynamics without arabinose removal see Fig. S3.

