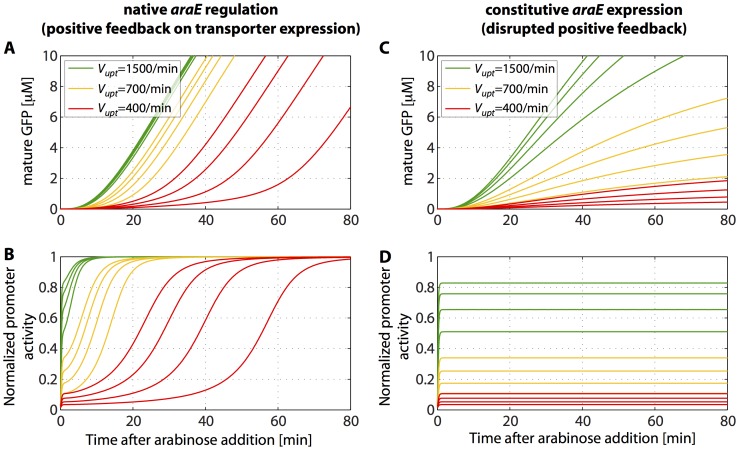
Figure 4. Theoretical gene expression kinetics for native and constitutive transporter production.
(A) Fluorescent GFP dynamics and (B) PBAD promoter activity for native transporter regulation. (C) Fluorescent GFP dynamics and (D) PBAD promoter activity for constitutive transporter production. Different external arabinose concentrations are represented by various arabinose uptake velocities Vupt. To illustrate stochastic variability in the initial number of uptake proteins, trajectories are shown for 300, 260, 220 and 180 AraE molecules at each Vupt. In all cases, the corresponding number of initial AraE molecules of the shown curves decreases from left to right.

