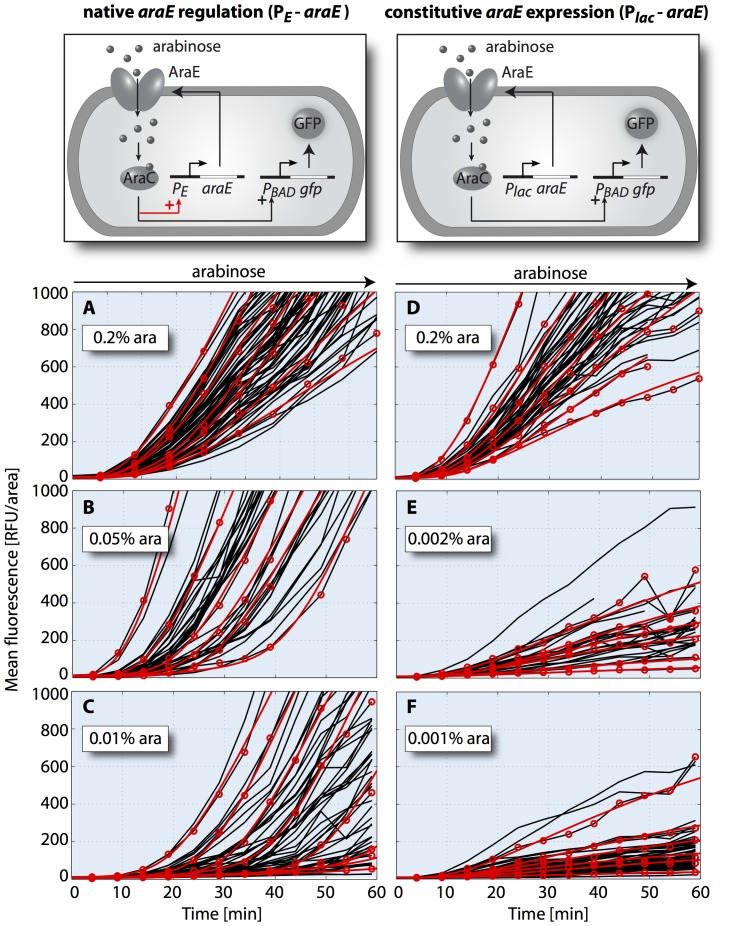
Figure 5. Single-cell induction kinetics of cells with native and constitutive transporter production.
Cells of strain JW1889-3 (A–C, native araE regulation) and JW1889-5 (D–F, constitutive araE expression) containing the reporter plasmid pBAD24-GFP were induced with indicated concentrations of arabinose. Black lines represent the kinetics of the mean fluorescence of individual cells and red circles highlight representative trajectories. Note that some trajectories disappear before the end of the experiment due to detachment of daughter cells after cell division. Red lines are representative fits of our full model of arabinose uptake and gene regulation in Eqs. (1)–(7) to the highlighted experimental trajectories. Number of evaluated cells: 71, 63 and 54 (for 0.2%, 0.05% and 0.01% ara induction of JW1889-3, respectively); 45, 28 and 57 (for 0.2%, 0.002% and 0.001% ara induction of JW1889-5, respectively).

