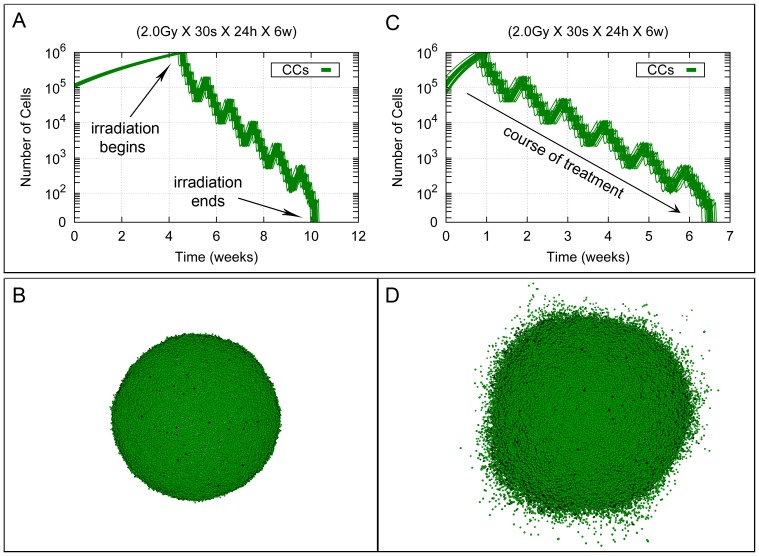
Figure 3. Standard radiotherapy treatment in a homogeneous tumor for the low and high migration cases.
Cell growth curves are shown corresponding to homogeneous tumor growth for the low and high migration cases when only CCs are present (see respectively (A) and (C)). Tumor growth is allowed unchecked from a size of about 105 cells until about 106 cells are present, which approximately occurs at day 30 (respectively at day 7) since the beginning of the process. Then, a homogeneous treatment corresponding to 30 sessions of 2.0 Gy each is delivered. In all cases, sessions are scheduled along 6 weeks separated by 24 hours intervals except for weekends, where a 72 hours interval is allowed. Radiotherapy treatment is thus completed 40 days afterwards its beginning (about 70 and 47 days since the initial stage respectively). Data corresponding to 20 simulations (with different seeds of a random number generator) are presented. Notice that the vertical coordinate is represented in a logarithmic scale. In (B) and (D) tumor stages are represented when radiation therapy is started (about 106 cells in total) for the low and high migration cases respectively. Depicted in dark and light green are proliferating and quiescent CCs. Dead cells are represented in black. See Movies S1 and S2 for an example of simulations represented in (A) and (C).

