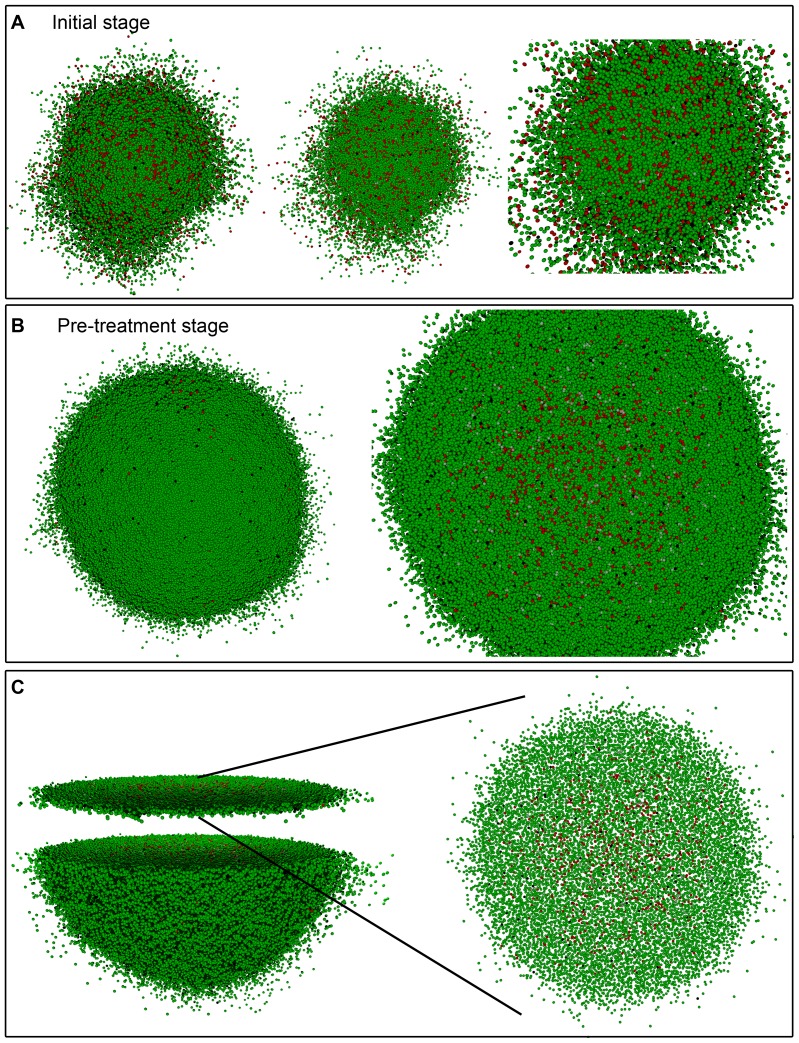
Figure 5. Simulated growth of a heterogeneous tumor with the high migration rate.
Depicted in dark and light green (respectively, dark and light red) are proliferating and quiescent CCs (respectively, proliferating and quiescent CSCs). Dead cells are represented in black. (A) An initial stage where about 105 cells, distributed into tumor cell phenotypes CC (85%) and CSC (15%), are present. (B) Tumor stage when radiation therapy is started (about 106 cells in total). In the right image, the spatial distribution of CCs and CSCs is shown for the case when  and CSC cycle duration equal to 48 h. A 3D transversal cut is performed in the middle of solid figure (B) (left), so that its interior could be seen (right). (C) Representation of the transversal cut showed in (B) for a slice of two cell diameters. Notice the comparatively large (with respect to Figure 4) space observed between cells.

