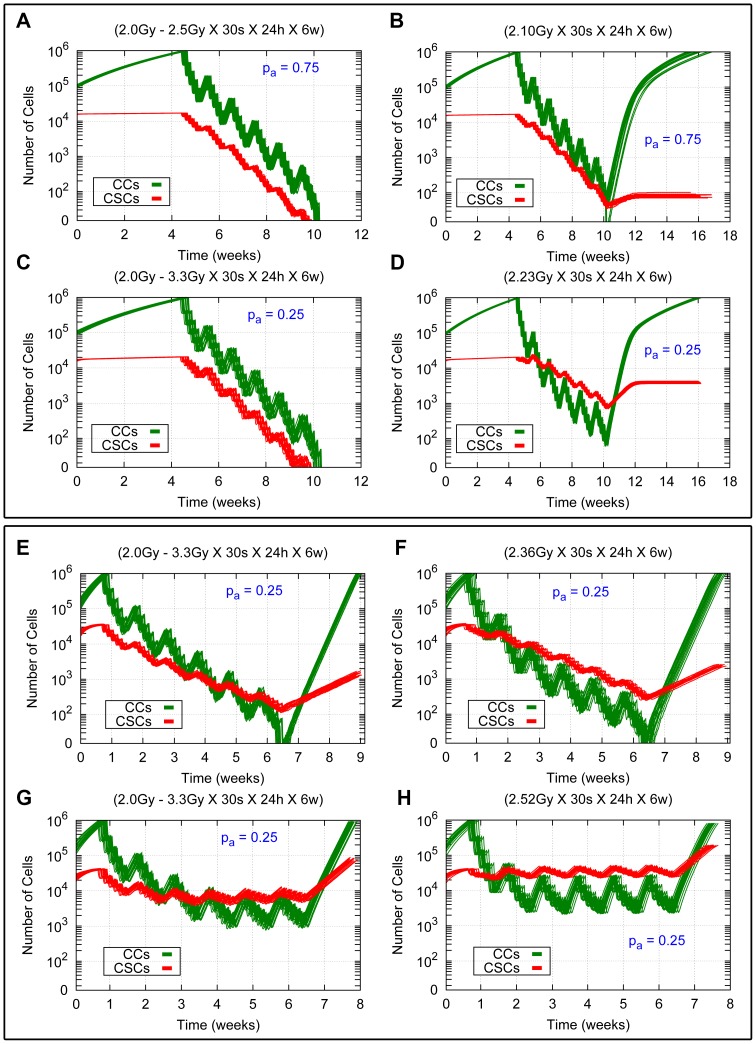
Figure 7. Comparing heterogeneous and averaged homogeneous radiation therapies in a heterogeneous tumor for different model parameters.
Cell survival curves for 20 simulations (with different seeds of a random number generator) in the cases  and
and  for CSC cycle durations equal to 96 h and 48 h with the high and low migration rates are shown. The time evolution for CCs and CSCs is represented in green and red respectively. (A, C, E, G) Results for heterogeneous therapies consisting of 2.5 Gy and 3.3 Gy in the inner sphere and 2.0 Gy in the rest of the tumor. (B, D, F, H) Results for the related averaged homogeneous therapies corresponding to 2.10 Gy, 2.23 Gy, 2.36 Gy and 2.52 Gy respectively. (A, B, C, D) Results for the cases
  and
and  with the low migration rate and CSC cycle duration equal to 96 h. (E, F, G, H) Results for the case
  with the high migration rate and CSC cycle durations equal to 93 h (E, F) and 48 h (G, H). In all cases 30 sessions are scheduled along 6 weeks, separated by 24 hours intervals except for weekends, where a 72 hours interval is allowed. Radiation is applied when the total cell count is about 106 cells. Notice that the vertical coordinate is represented in a logarithmic scale. See Movies S3, S4, S7 and S8 for an example of simulations represented in (B), (D), (G) and (H) respectively.

