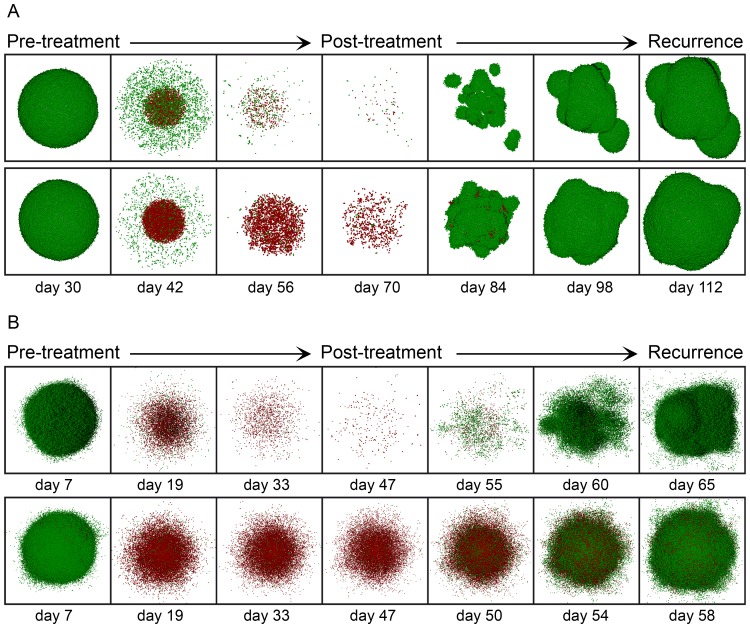
Figure 8. Time evolution of tumor growth during and after averaged homogeneous radiation therapies.
(A) A homogeneous dose of 2.10 Gy for the case  is delivered (Top), and a homogeneous dose of 2.23 Gy for
  is instead applied (Bottom), assuming in both cases of (A) the low migration rate and CSC cycle duration equal to 96 h. (B) A homogeneous dose of 2.36 Gy is delivered (Top) and a homogeneous dose of 2.52 Gy (Bottom) for the case
  with the high migration rate and CSC cycle durations equal to 96 h (Top) and 48 h (Bottom). In all cases (A, B) a standard scheduling (30 sessions along 6 weeks separated by 24 hours intervals except for weekends) was applied. From left to right we show in sequential order the tumor before radiotherapy treatment starts, its state after sessions 10, 20 and 30, and three stages corresponding to recurrence during the period covered (where about 106 cells is again obtained). Depicted in dark and light green (respectively, dark and light red) are proliferating and quiescent CCs (respectively, proliferating and quiescent CSCs). Dead cells are not represented.

