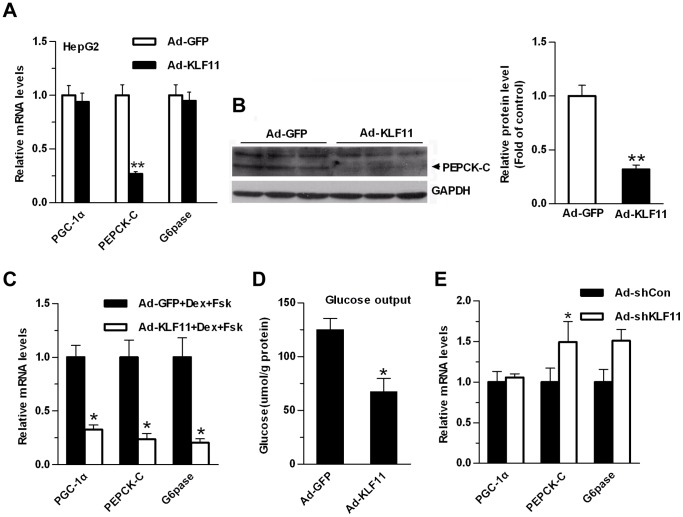
Figure 3. KLF11 regulates the expression of the gluconeogenic genes in HepG2 cells and mouse primary hepatocytes.
(A) qRT-PCR analysis of the mRNA expression levels of gluconeogenic genes in HepG2 cells infected with adenoviruses Ad-GFP or Ad-KLF11. (B) Western blot analysis of the protein levels of PEPCK-C in HepG2 cells infected with Ad-GFP or Ad-KLF11 adenoviruses. GADPH was used to show the similar amount of protein loaded in different lanes (Left panel). The relative intensities of PEPCK-C bands on the Western blot were determined using NIH Image 1.62 software and normalized using GADPH band intensity (Right panel). (C) qRT-PCR analysis of the mRNA expression levels of gluconeogenic genes in primary hepatocytes infected with adenoviruses Ad-GFP or Ad-KLF11. At 24 hr after infection, hepatocytes were switched to starvation media for 6 hr, followed by treatment with 10 µM forskolin and 1 µM dexamethasone for 1.5 hr. (D) Measurement of cellular glucose production in primary hepatocytes as described in Fig. 3C. (E) qRT-PCR analysis showing the expression levels of gluconeogenic genes in primary hepatocytes infected with control Ad-shCon or Ad-shKLF11. Hepatocytes were grown for 2 days post-infection in RPMI-1640+10% FBS. The data shown were the means ± SEM (n = 3). Statistical significance was determined using a two-tailed Student’s t-test. * on each bar indicated the comparison between Ad-KFL11 and Ad-GFP infection (*P<0.05, **P<0.01).

