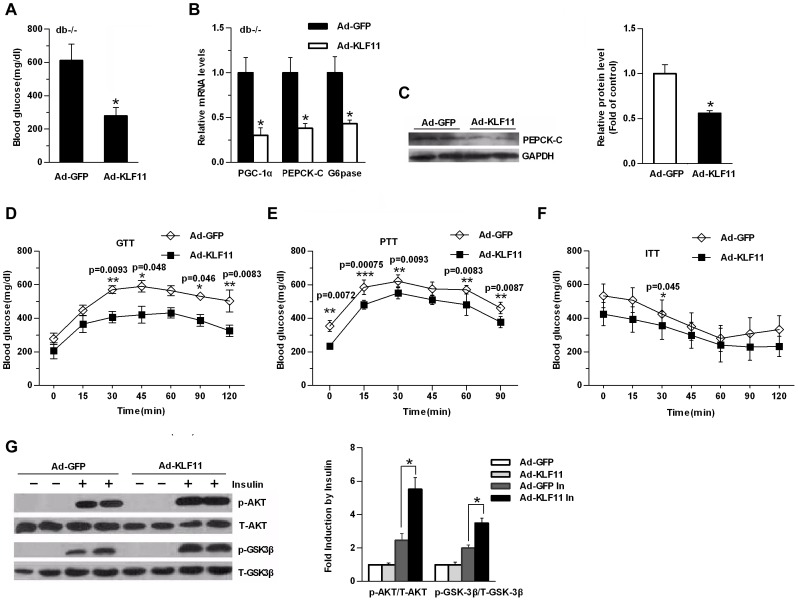
Figure 4. Overexpression of KLF11 in db/db mice alleviates hyperglycemia.
(A) Blood glucose level in control Ad-GFP or Ad-KLF11-injected db/db mice 7 days after injection under fasting conditions (n = 6/group, 6-hr fasting). (B) qRT-PCR showing the mRNA levels of gluconeogenic genes in the livers of the same mice as in (A) (n = 6/group). (C) Western blot analysis showing the protein levels of PEPCK-C in in the livers of the same mice as in (A) (n = 6/group). GADPH was used to show the similar amount of protein loaded in different lanes (Left panel). The relative intensities of PEPCK-C bands on the Western blot were determined using NIH Image 1.62 software and normalized using GADPH band intensity (Right panel). (D–F) Glucose tolerance tests (GTTs) (D), pyruvate-tolerance tests (PTT) (E), Insulin tolerance tests (ITTs) (F) in control Ad-GFP or Ad-KLF11 -injected db/db mice 5 days after injection (n = 6/group). All data are presented as mean ± SEM, with statistical analysis performed by repeated-measures two-way ANOVA (*p<0.05, **P<0.01, ***P<0.001). (G) Db/db mice were injected with Ad-KLF11 or Ad-GFP. After 5 days, the mice were fasted overnight and anesthetized with tribromoethanol followed by IP injection of 5 U of insulin or saline (as a control). Ten minutes later, the animals were sacrificed, and their liver protein lysates were subjected to Western blot analysis (Left panel). The relative intensities of Phospho-Akt, total Akt, phosphor-GSK3β and total GSK3β were quantitated by densitometry analysis of their bands on film. The results are expressed as the ratios of phospho-Akt/total Akt and phosphor-GSK3β/total GSK3β (statistical analysis of Western blot data from 4 mice under each condition; Right panel). The data shown are the means ± SEM. Statistical significance was determined using a two-tailed Student’s t-test (*P<0.05, **P<0.01).

