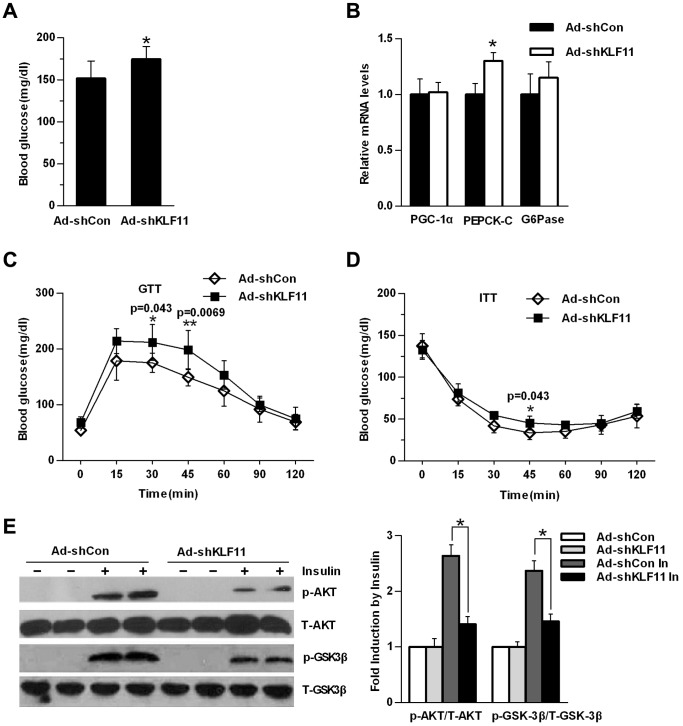
Figure 5. Knockdown of KLF11 in db/m mice livers impairs glucose homeostasis.
(A) Blood glucose levels in control Ad-shCon- or Ad-shKLF11-injected db/m mice 7 days after injection under fasting conditions (n = 7/group, 6-hr fasting). (B) qRT-PCR analysis showing mRNA levels of gluconeogenic genes in the livers of the same mice as in (A) (n = 7/group). (C–D) Glucose tolerance tests (GTTs) (C) and insulin tolerance tests (ITTs) (D) in control Ad-shCon- or Ad-shKLF11-injected db/m mice 7 days after injection (n = 7/group are sure this is 7 not 6). All data are presented as mean ± SEM, with statistical analysis performed by repeated-measures two-way ANOVA (*p<0.05, **P<0.01). (E) Db/m mice were treated as described in (A). 5 days after adenovirus infection (ad-shKFL11 or ad-shCon), mice were fasted overnight and anesthetized with tribromoethanol followed with the injection of 5 U of insulin or saline (as a control) via the inferior vena cava. Five minutes later, the animals were sacrificed, and the liver protein lysates were subjected to western blot analysis. The relative intensities of insulin signaling molecules were quantitated by densitometry analysis of their bands on film. The results are expressed as the ratios of phospho-Akt/total Akt and phosphor-GSK3β/total GSK3β (statistical analysis of western blot data from 4 mice under each condition; Right panel). The data shown are the means ± SEM. Statistical significance was determined using Student’s t-test (*p<0.05, **p<0.01).

