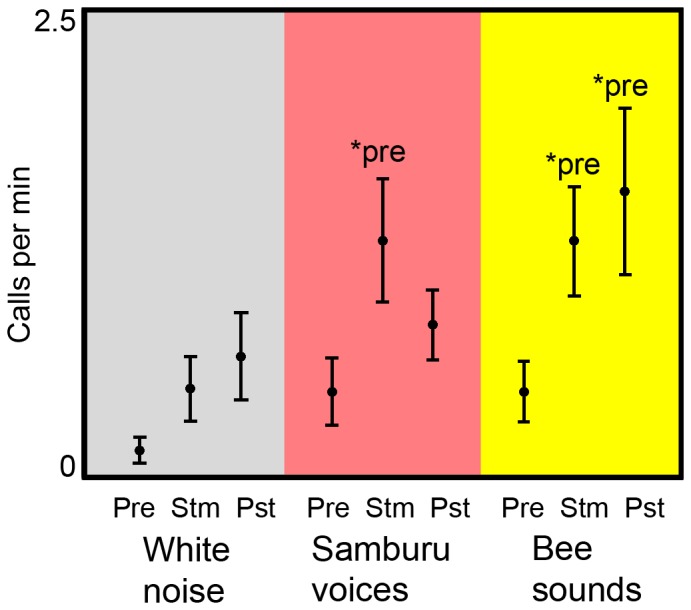
Figure 3. Call rate in response to original sound playbacks.

Call rate (mean ± SEM) across phases of playback trials for white noise (n = 13), Samburu voices (n = 14) and bee sounds (n = 15). Pre = pre-stimulus phase; Stm = stimulus phase; Pst = post-stimulus phase. *pre = significantly different from pre-stimulus phase.
