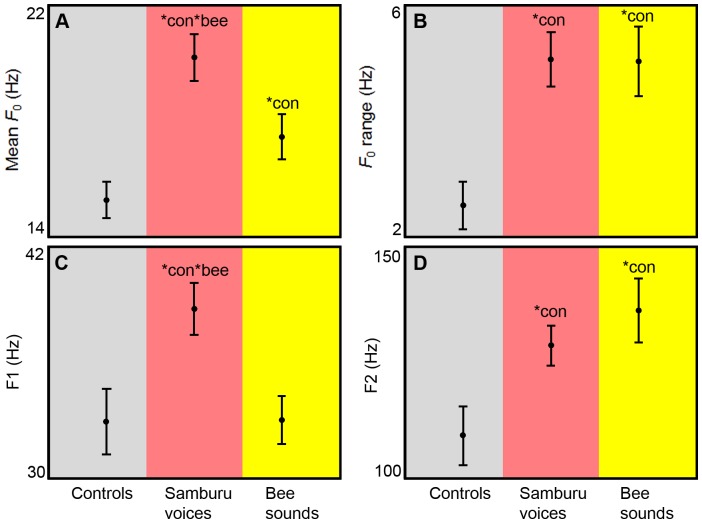
Figure 4. Acoustic structure of rumbles made in response to original sound playbacks.
Acoustic features (mean ± SEM) of rumbles produced during pre-stimulus control phases (n = 18), and in response to Samburu voices (n = 20) and bee sounds (n = 20). A) Mean fundamental frequency (F 0). B) F 0 range. C) The first formant (F1) location. D) F2 location. *con = significantly different from controls. *bee = significantly different from bee sounds.

