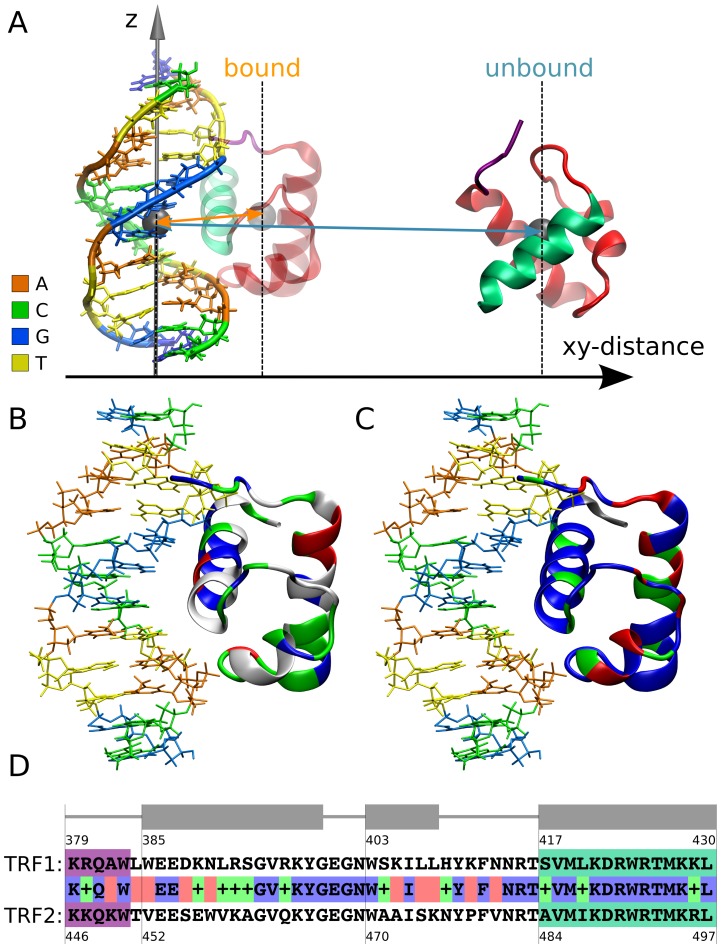
Figure 1. TRF-DNA complex structure and comparison of the TRF1/TRF2 DBD domains.
(A) A schematic representation of the system used for the calculation of the binding free energy profiles. The DNA dodecamer (5′-GGTTAGGGTTAG-3′) is aligned with the z axis, and the xy-distance between the centers of mass of TRF and DNA serves as a convenient reaction coordinate describing the binding process (for a precise definition of the reaction coordinate, see Methods and Fig. S1). The C-terminal recognition helix interacting with the DNA major groove is shown in green and the N-terminal linker binding within the minor groove is in purple. (B) Distribution of different types of amino acid residues in the TRF2 structure: hydrophobic residues are depicted in white, hydrophilic in green, basic in blue and acidic in red. (C) Differences in amino acid sequence between TRF1 and TRF2 mapped onto the TRF2 structure in a color coded manner: identical amino acids are marked in blue, green denotes conservative substitutions (little change) and red non-conservative substitutions (significant change). (D) Alignment of TRF1 and TRF2 sequences. Color-coding is consistent with panel C. The purple and green highlights denote the N-terminal linker and the C-terminal helix, respectively.

