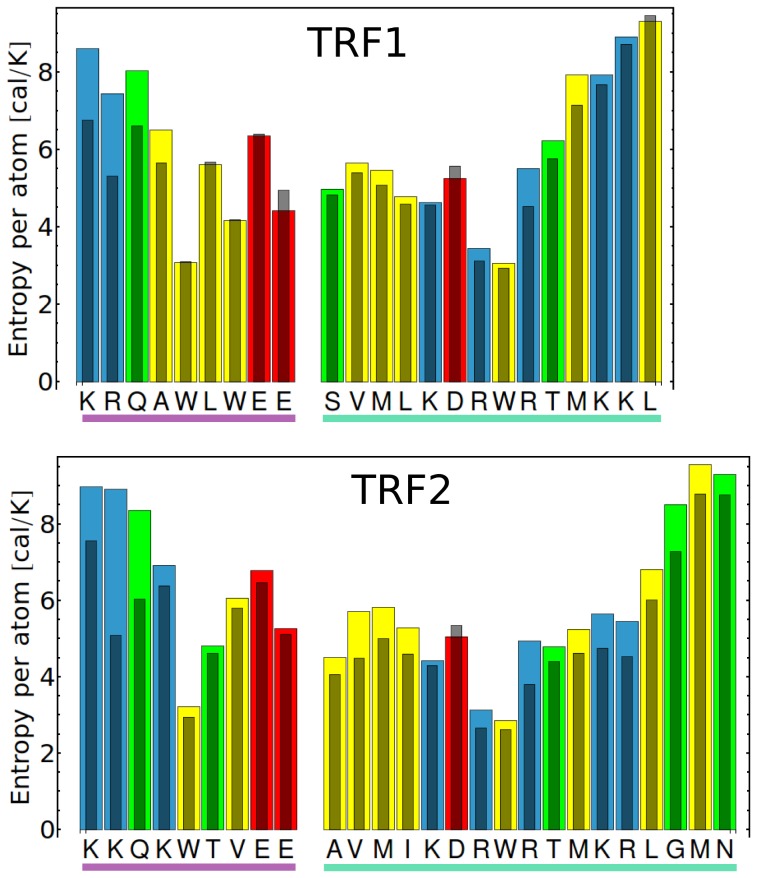
Figure 5. Protein entropy changes upon DNA binding.
Conformational entropy per atom for individual protein residues in the tightly-bound complex with telomeric DNA (narrow bars) and in the isolated state (wide bars, colored according to amino acid type), estimated using the quasi-harmonic approximation. Only the regions interacting directly with DNA in the tightly-bound complex are presented: the N-terminal linker (purple) and the C-terminal helix (green).

