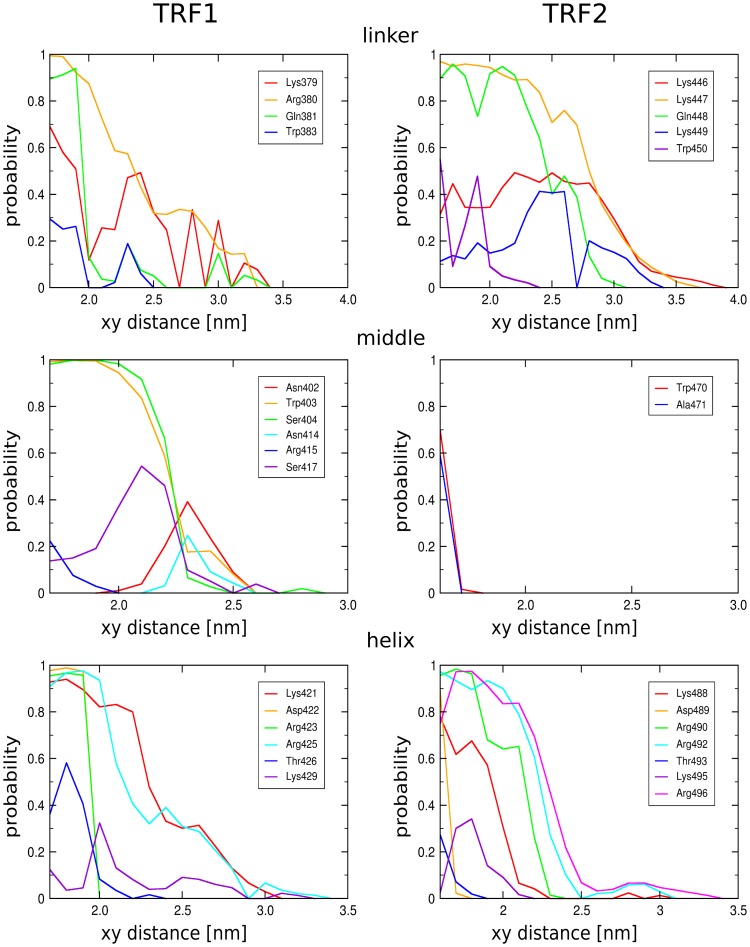
Figure 7. Hydrogen bond profiles for individual TRF residues.
The probability of hydrogen bond formation between individual protein residues and DNA as a function of the distance from the DNA axis. Only the residues for which the probability exceeds 0.2 are presented. The protein structure is subdivided into three separate regions: the N-terminal linker (top), the middle region (middle) and the C-terminal helix (bottom).

