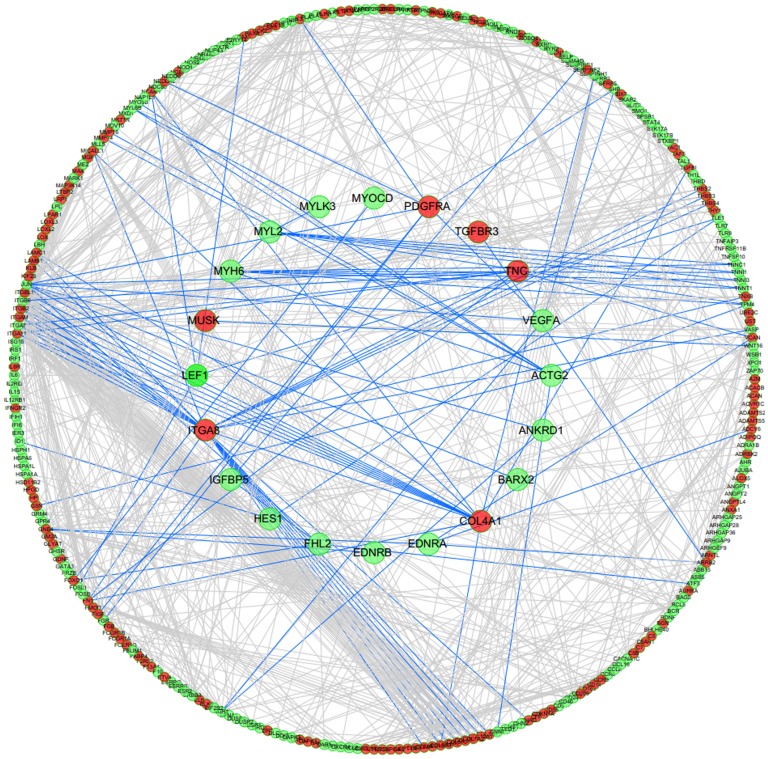
Figure 2. Protein-protein interaction network of the significantly differentially expressed genes.
The sketch represents the interaction network constructed for 1,009 protein-coding DEGs. The red and green dots represent the up-regulated and down-regulated genes, respectively. The 20 proteins related to muscle cell development are underlined in the center of the circle. The lines represent the interactions between the gene products.

