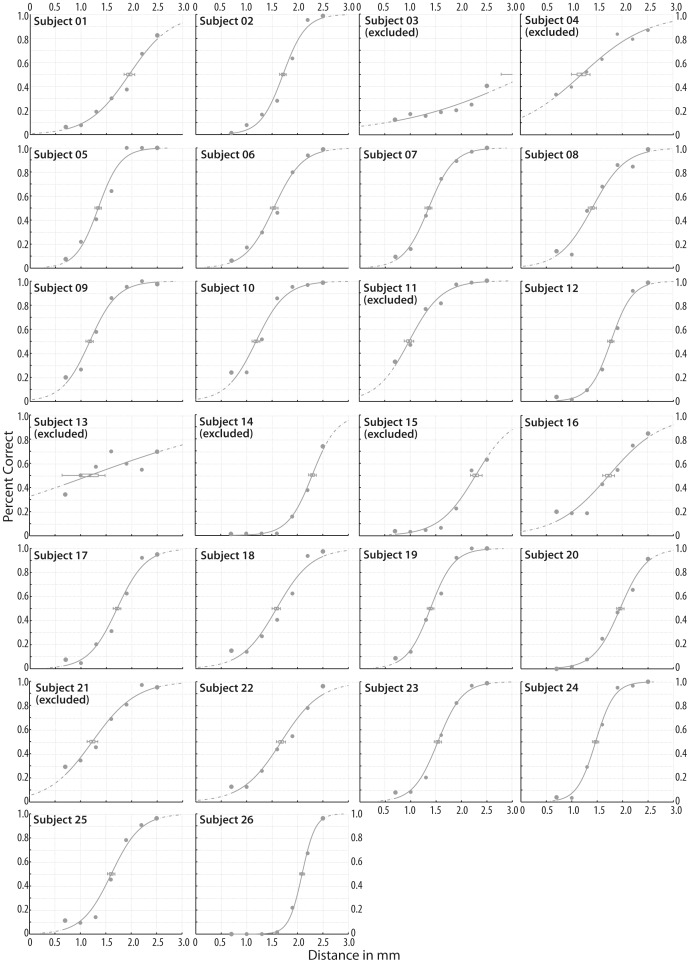
Figure 1. Individual psychometric functions of the 2-point discrimination task.
The figure shows individual psychometric functions for each of the 26 participants. The percentages of ‘distance felt’ answers across pin distances (depicted as dots) were fitted with a binary logistic regression and the spatial discrimination threshold was defined as the pin distance closest to the 50% crossing of the fitted sigmoid curve. Error bars are confidence limits derived from bootstrapping 1999 curve fitting simulations. Subjects 3, 4, 11, 13, 14, 15, and 21 were excluded from further analyses (see Materials and Methods).

